Ever watched a stock climb or fall for days and wondered when it’s about to run out of steam? This guide will show you how to spot trend exhaustion on stock charts, helping you catch those turning points as a beginner. It’s simple, clear, and packed with steps to get you started.
Keep reading until the end to learn all of the interesting facts!
Spotting Trend Exhaustion Signs
Here’s how to tell when a trend’s getting tired:
Watching Price Slowdowns
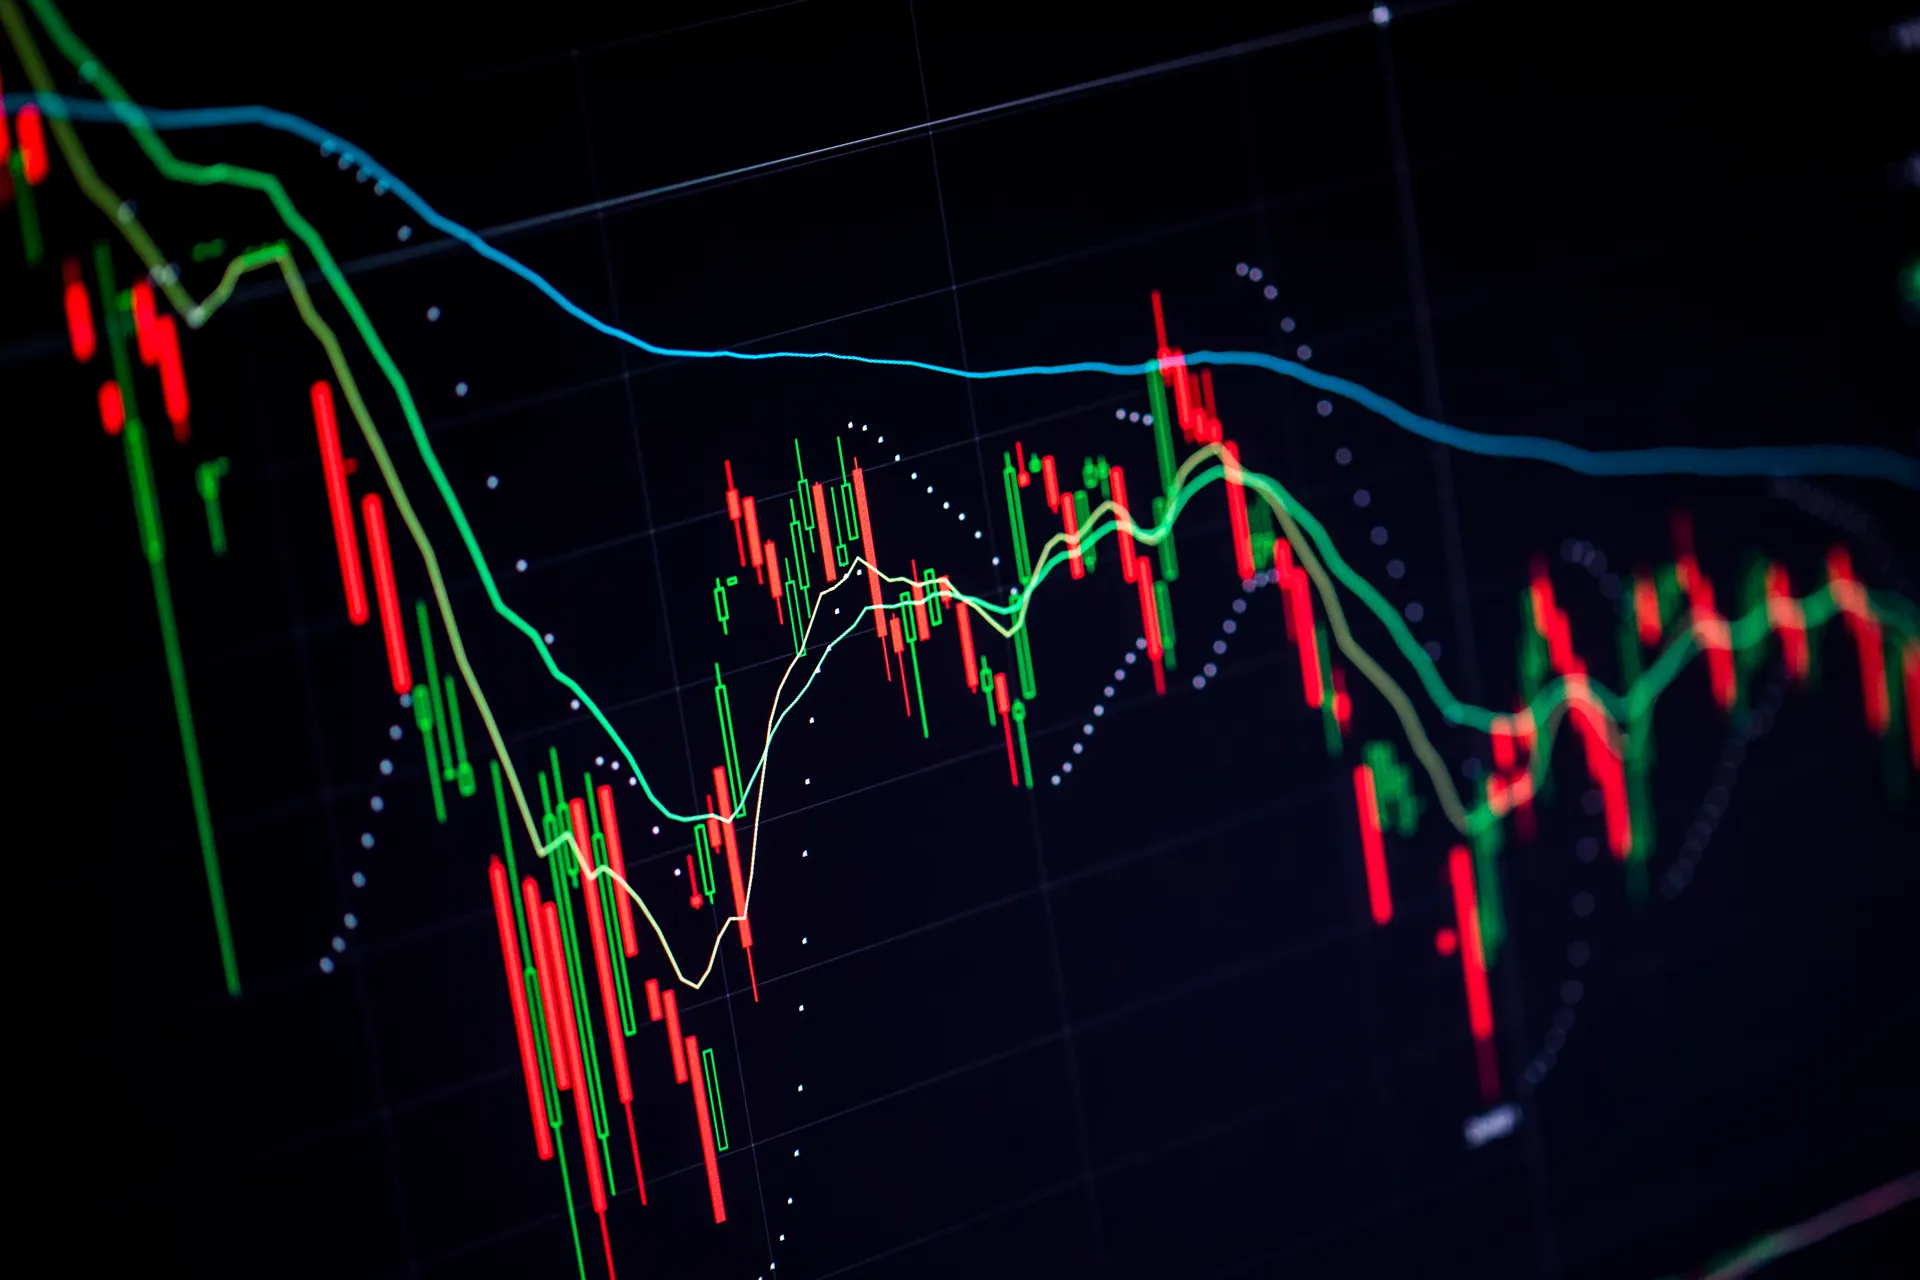
When a trend—like a big upswing—starts to exhaust, price moves slow down. You might see smaller daily gains—say, dropping from 3% to 1%—or tighter ranges near a peak. It’s not just stalling. It’s a neat clue the push is fading, showing up across tech stocks or steady names alike.
- Check your chart—those shrinking candles after a long run often mean the steam’s running low.
Volume Drop-Offs
Volume tells a big story—rising trends need fuel, but exhaustion hits when it dips. If a stock’s been climbing with heavy trading, then volume shrinks—like from millions to thousands—it’s a sign buyers or sellers are stepping back. It’s your heads-up that momentum’s winding down.
Look at the bars under price; a fade here can scream exhaustion louder than price alone.
Divergences with Indicators
Indicators like RSI or MACD can diverge—price hits a new high, but RSI flattens or drops, hinting the trend’s losing juice. It’s a comfy way to spot trouble brewing, even if the price looks strong. These mismatches often pop up late in a move, giving you an early warning.
Trading When Trends Tire Out
Here’s how to trade those fading trends:
Setting Up Your Chart Tools
Grab a platform that’s easy to navigate, one that charts price, volume, and indicators like RSI without a fuss. Most setups have these built in. Toss in some cash you’re okay risking—trends can fake you out, so it’s about odds, not sure bets. Additionally, familiarize yourself with the best indicators for stock market trends to enhance your analysis. By combining these tools with your research and market understanding, you’ll increase your chances of making informed decisions. Remember, disciplined trading and continuous learning are essential to navigating the often unpredictable landscape of the stock market.
Pick a system that keeps you moving smoothly, with real-time data so you’re not late to the turn. Load up a stock you’re tracking—maybe a retailer or a tech play—and add your tools to watch for exhaustion.
Catching Exhaustion Trades
When you spot signs—say, slowing price and falling volume—look to sell a rising trend or buy a falling one. If RSI diverges at a peak, sell or short; if it bottoms out, buy. Step in when signals align, letting the chart guide you, not just jumping on hope.
- It’s your chance to catch the flip before the crowd does.
Adjusting as Trends Fade
Once exhaustion shows, tweak your trades. Exit a long if price stalls and volume dries up—maybe after a 2% pop that fizzles. Hold or reverse if a bounce kicks in post-drop. Adjust over hours or days, using early hints to feel the shift. Keep it steady, learning the stock’s wind-down.
How to Identify Trend Exhaustion in Stock Charts – Tips & Tricks
These pointers will help you trade it like a pro:
Quick Steps to Spot It
- Watch candle size; small ones signal fade.
- Check volume trends; drops mean weakness.
- Look at RSI; flat spots warn you.
Finding Strong Exhaustion Signals
- Spot big divergences; they’re loud clues.
- Note stalled highs; they show fatigue.
- Track low volume; it confirms the turn.
Keeping Risks in Check
- Don’t bet all your cash on one fade; spread it.
- Risk a small piece each time; stay safe.
- Wait for clear signs; shaky moves can trick you.
How Exhaustion Shows on Charts
Here’s what you’ll see when trends tire:
The Peak or Trough Slowdown
At a trend’s end—like a month-long rally—price might creep to a high, then wobble with tiny moves. It’s the top-out phase, where gains shrink and buyers hesitate. You’ll see it on daily or hourly charts, marking the slowdown.
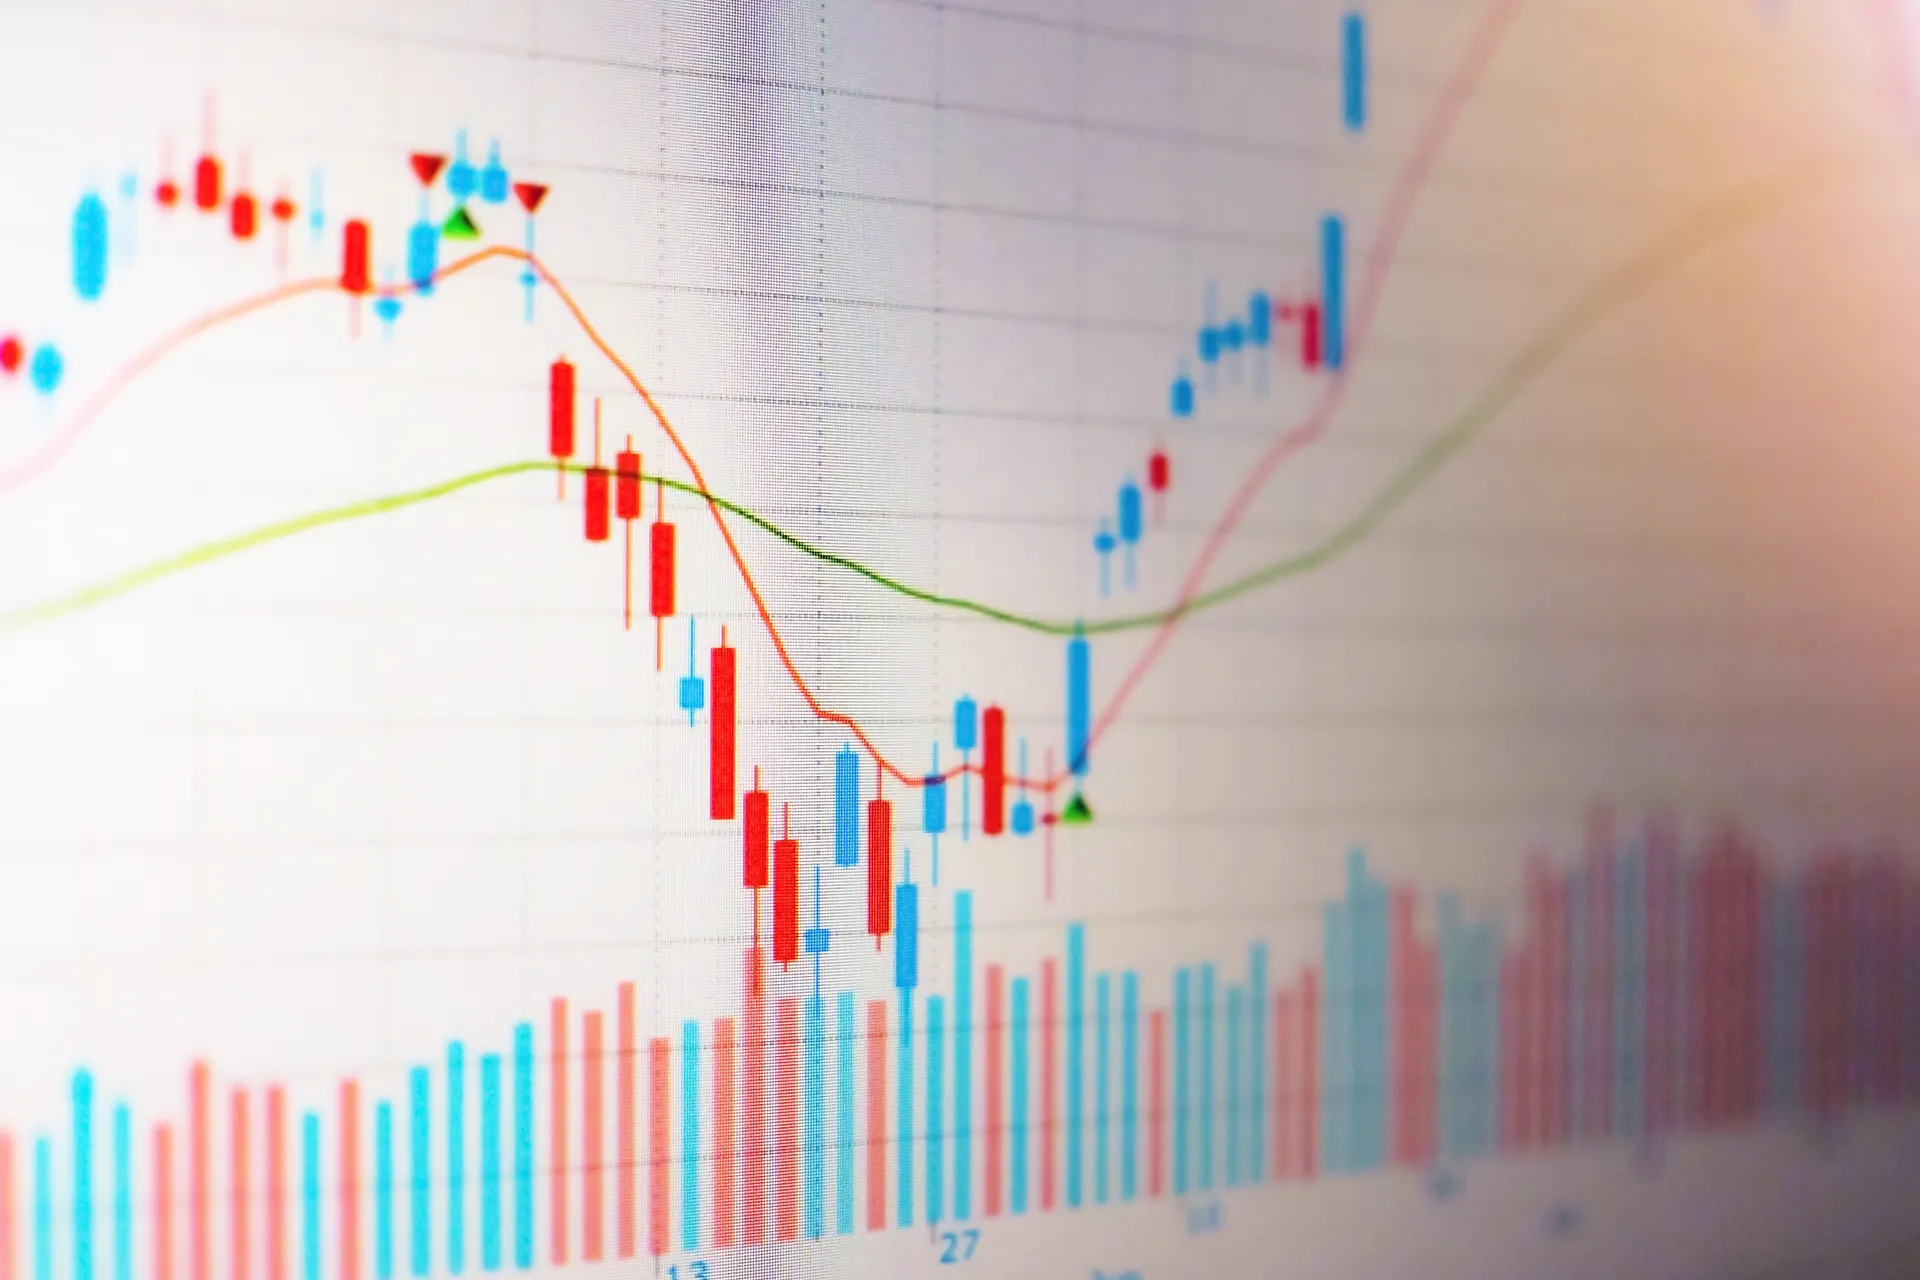
The Volume Fade
As exhaustion builds, volume often thins—say, a stock drops from 5 million shares traded to 1 million. It’s the fuel running dry, hintingthe trend’s losing its crowd. Watch those bars shrink; it’s a big tell.
The Indicator Tip-Off
RSI or MACD might lag—price pushes up, but indicators stall or dip, like RSI hitting 70 then easing while price climbs. It’s the divergence shouting the trend’s on borrowed time.
What Drives Trend Exhaustion?
Let’s unpack the forces behind fading trends:
Trader Fatigue and Profit-Taking
Trends tire when traders cash out—buyers stop chasing a high, or sellers quit dumping a low. A stock up 50% might see profit-taking, draining the push. It’s human nature shifting the chart.
Market News and Shocks
Big news—like earnings misses or rate hikes—can sap a trend. A tech rally might fade on bad guidance, flipping volume and price fast. It’s the outside jolt shaking the move.
Sector and Economic Vibes
A sector boom—like energy on oil spikes—might exhaust if prices peak; broader markets slowing can drag it too. Jobs data or Fed moves play in, setting the stage for a turn.
Timing Trades Around Exhaustion
Timing’s everything—here’s how to nail it:
Early Hints Before the Turn
Days or hours before exhaustion—say, a week of shrinking gains—volume might dip while price creeps up, like a 1% rise on half the usual trades. It’s your early cue to watch closely, maybe setting a sell if RSI flattens too.
The Exhaustion Break Moment
When it hits—price stalling at a high with volume crashing, maybe a 2% gain gone flat—trade quick. Sell or short a top; buy a bottom if volume hints at a flip. It’s the hot minute to catch the turn; stay sharp, it’s fast.
Post-Exhaustion Settle
After the break—hours or a day later—the stock might reverse or range. A drop post-rally, say 5% down by close, could mean more selling; a bounce might hold. This settle-down phase helps you adjust or exit.
Quick Recap:
This guide’s shown you how to identify trend exhaustion in stock charts, giving you a clear way to spot fading moves. You’ve got the steps and tips to trade it without a stumble. Good luck out there!
FAQ
What is trend exhaustion?
Trend exhaustion occurs when a strong price trend begins losing momentum, signaling a possible reversal or consolidation phase.
What signs indicate exhaustion?
Divergence, weakening momentum indicators, and slowing price movement near key levels can signal a trend may be ending.
Why is identifying exhaustion important?
Recognizing exhaustion helps traders avoid entering late in a trend and prepares them for potential reversals.
Can traders confirm exhaustion signals?
Combining momentum indicators, volume analysis, and price structure improves confirmation before acting on potential reversals.