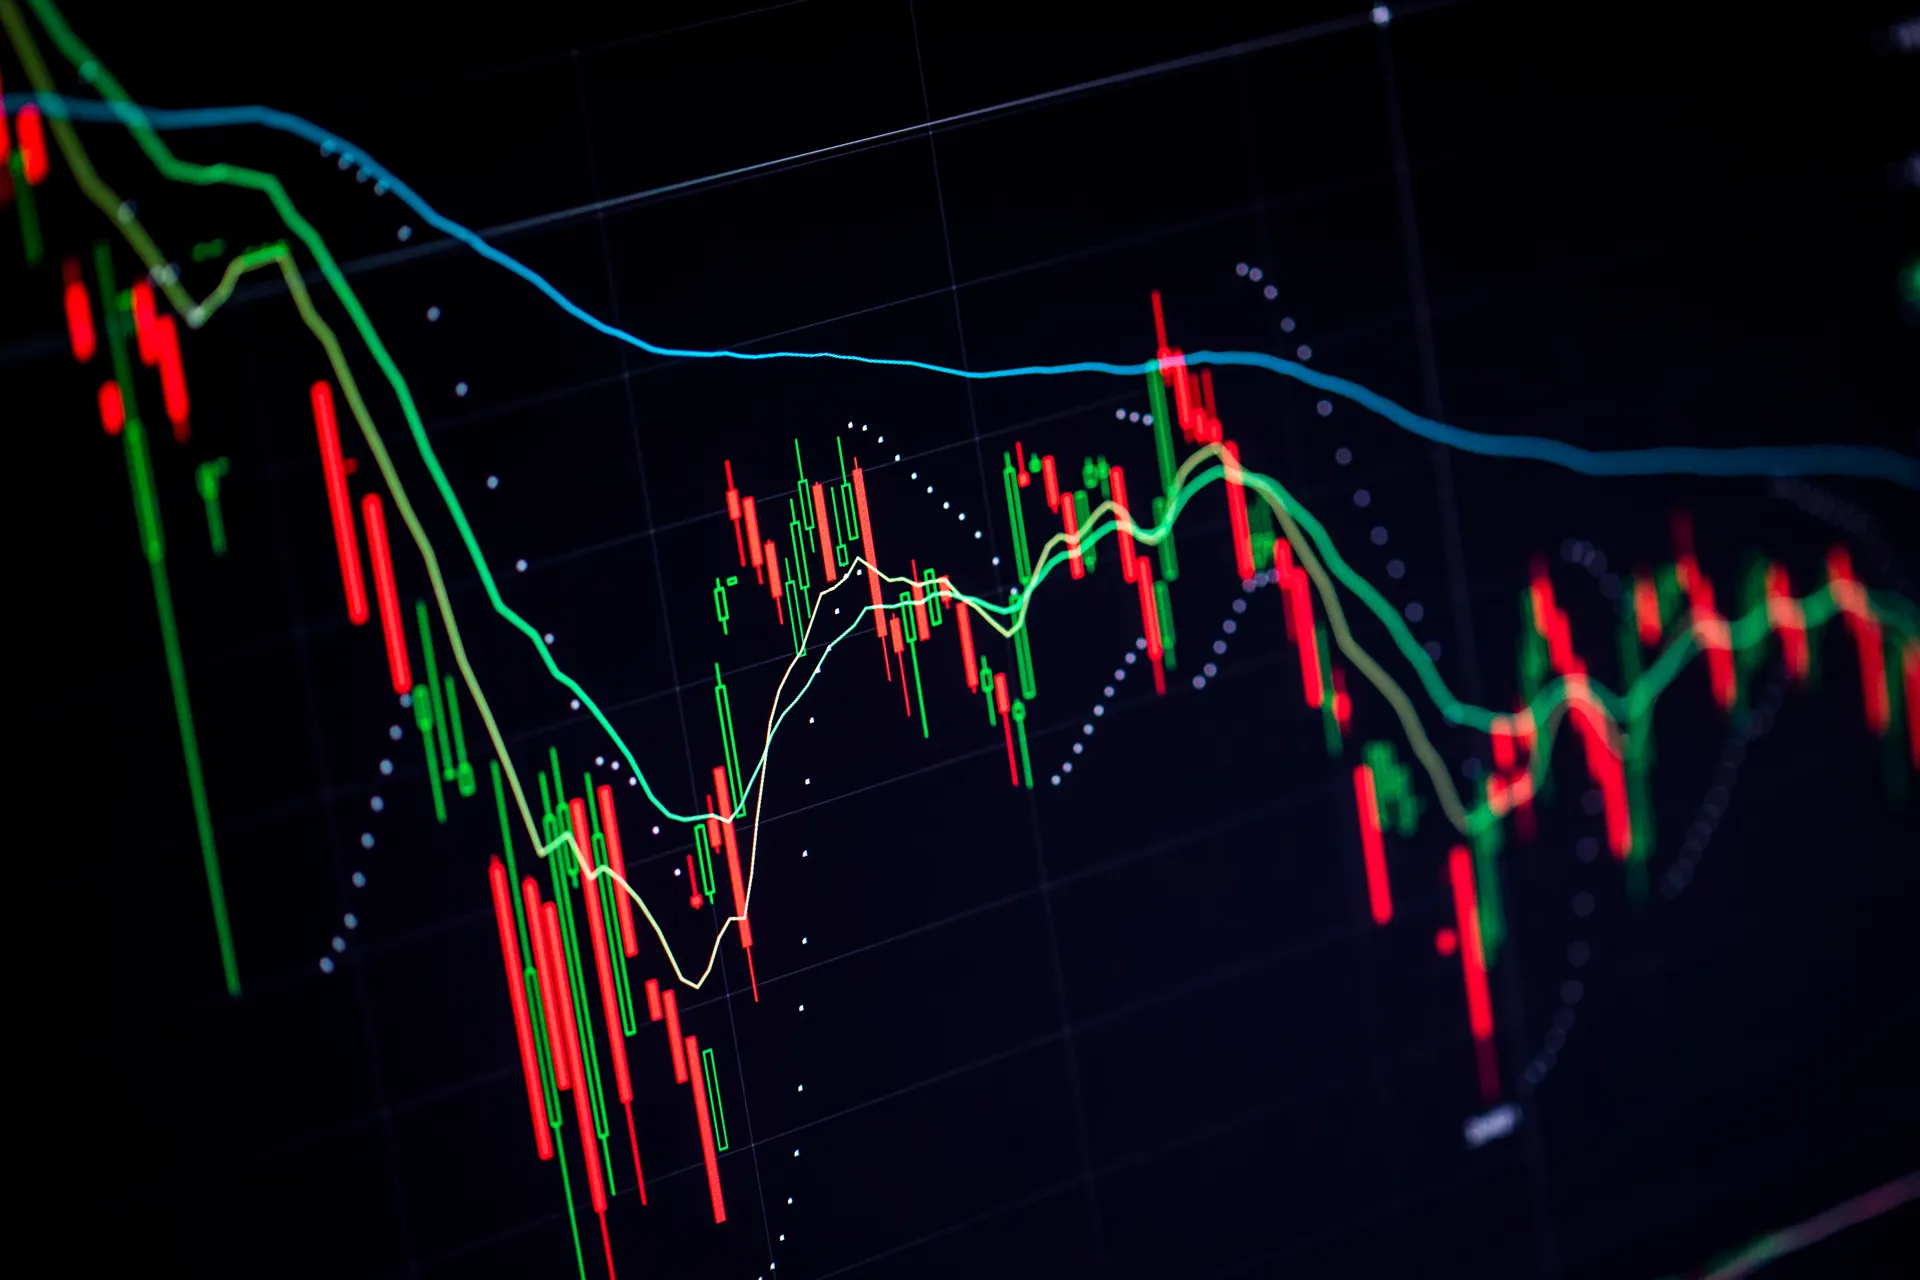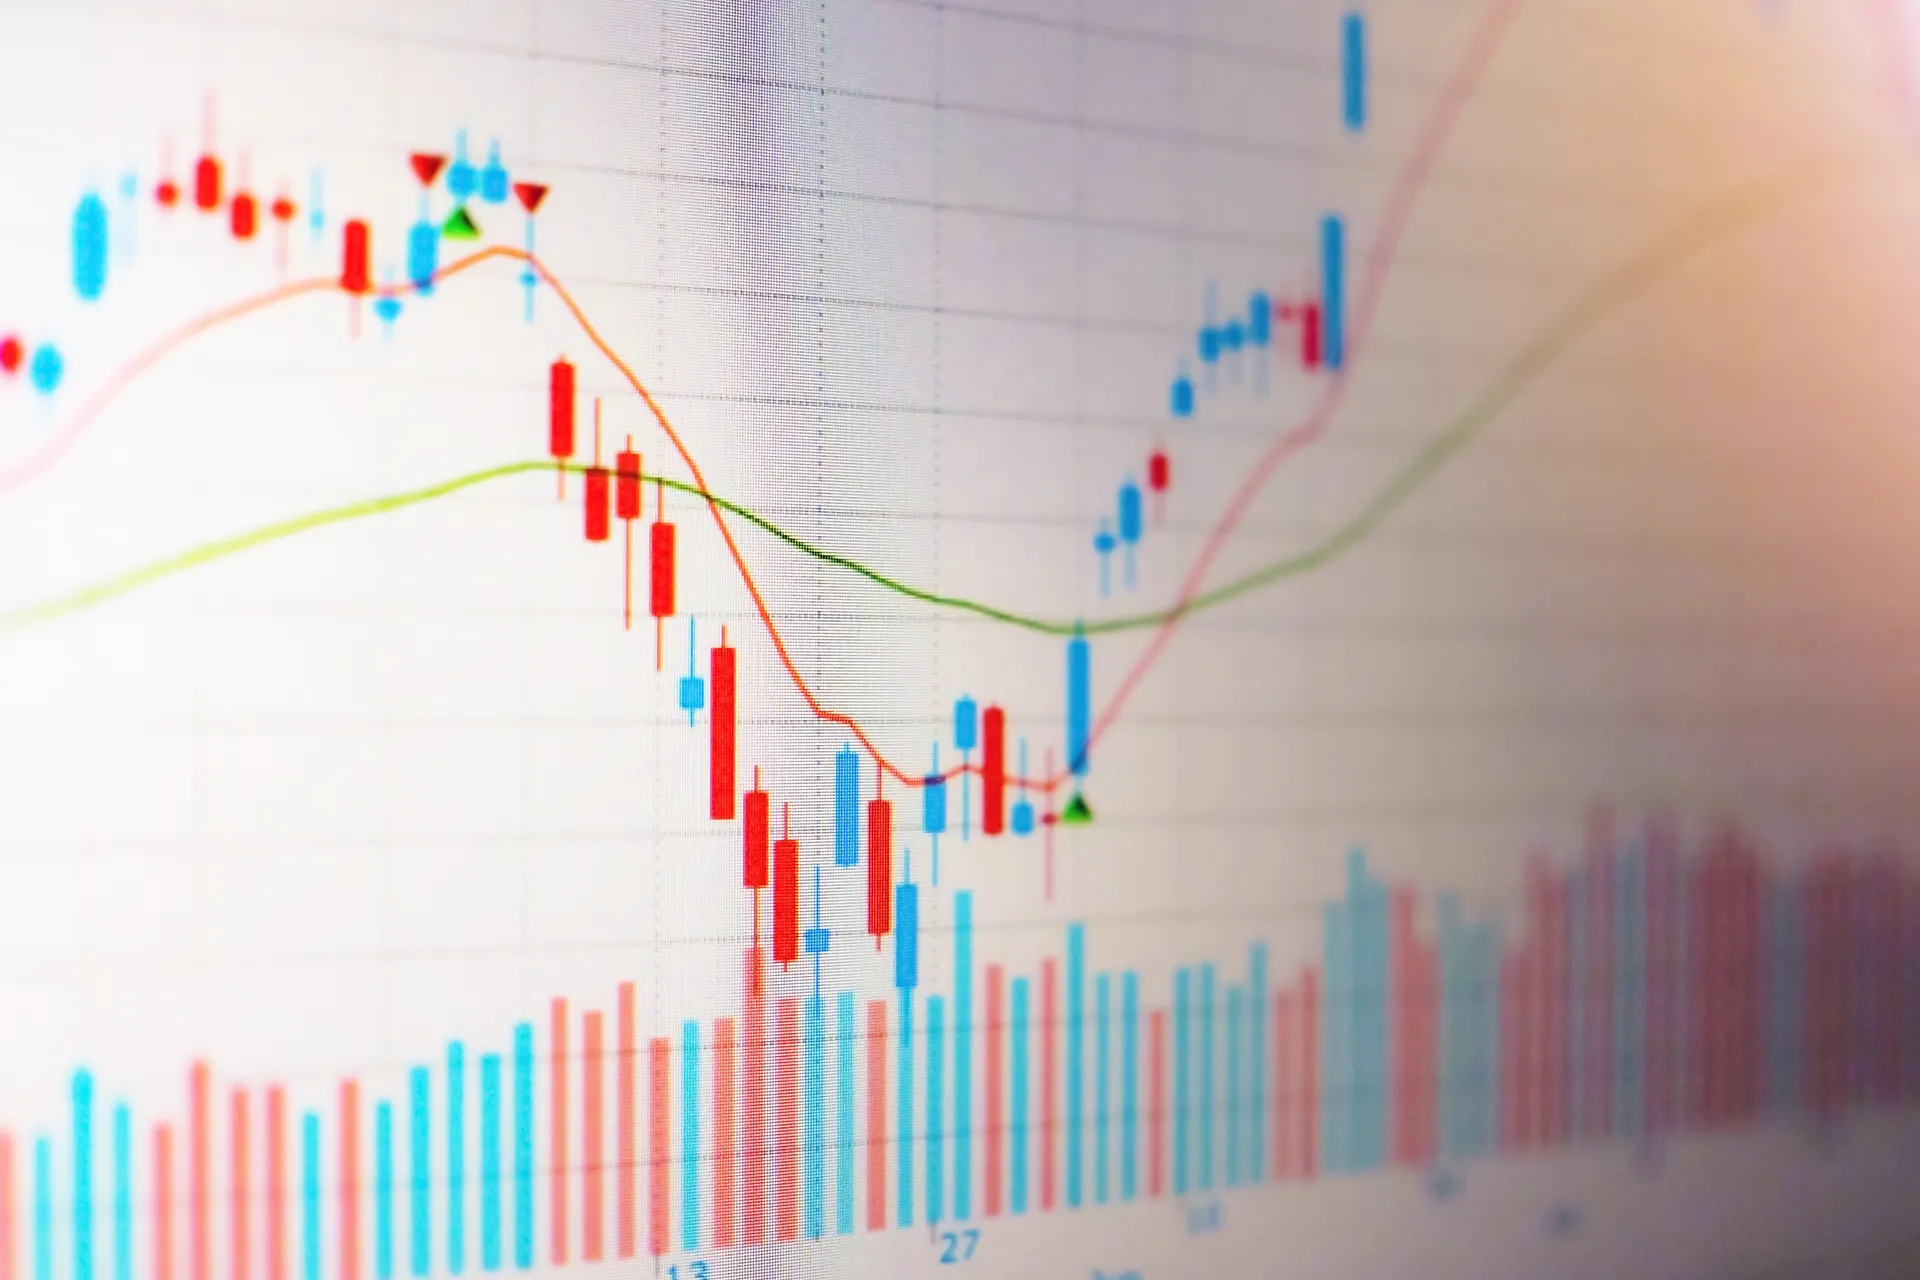

Picture a rollercoaster ride where the car climbs slowly before plunging into a sharp drop—that’s what market volatility feels like. In money talks, volatility shows how quickly and how far the price of an asset, whether it’s a currency pair, stock, food commodity, or bitcoin, jumps up and down during a set time.
This short guide walks you through what drives those swings, how people measure them, and what they mean for anyone using our CFD platform—all done in a way that meets the rules we play by.
Defining Market Volatility
Put simply, market volatility shows how much prices wiggle from the average value over hours, days, or even weeks. Years of calm trading might tuck a stock into a low-volatility box, where gains and losses rarely break 2 percent in a session. Then a sudden tweet, bad earnings call, or world headline flips the script, pushing the same share up 10 percent one morning and down 8 percent the next.
High volatility means big swings can unfold in minutes. Low volatility indicates that the road will be lumpier but flatter for a while. Either way, the trait belongs to every asset class, and spotting it helps a trader read the market’s mood long before a buy-or-sell alert arrives.
What Causes Market Volatility?
Many moving parts poke the engine of volatility, shaking prices across global exchanges:
- Economic Events: Numbers like GDP growth, jobless claims, and central bank rate decisions can stir giant waves. Imagine the jitter that follows a Fed rate lift. Dollar-denominated pairs tend to tumble, soar, or both within seconds of the statement.
What Makes Prices Jump Today?
- World Events: Tense trade talks or a big election can rattle investors and send stocks or oil prices in unexpected directions.
- Market Mood: Trader confidence and fear spreads fast on news sites and social feeds, making coins like Bitcoin bounce around.
- Thick or Thin Markets: When few people are trading at night or on holidays, even small orders can move prices a lot. Busy hours usually calm things down.
How to Effectively Measure Market Volatility?
Every trader needs a way to judge ride-and the major tools do the heavy lifting:
- Historical Volatility looks backwards, adding up daily price swings for 30 days or so to show past ups and downs.
- Implied Volatility lives inside an options price. It guesses future jitters and is popular with stock and index fans.
- Average True Range (ATR) picks an asset’s highest candle minus its lowest one, averages that over 14 days, and tells forex and commodity lovers how quiet or loud the market has been.
Bollinger Bands stretch out or pinch together around a price line. Wide bands shout that prices are hopping; narrow bands whisper that calm might break.
Volatility Across Different Markets
Every financial market has its own personality, and that personality shapes how much prices bounce around.
- Forex Markets
Currency pairs such as EUR-USD or GBP-JPY tend to wiggle the most right before or after a big economic report or central bank statement. Major pairs usually drift more gently because they are heavily traded, while exotic pairs can jump sharply during quiet hours when fewer traders are watching.
- Stock and Index Markets
Individual shares, think Apple or Tesla, often swing wildly during earnings season or just after a big company announcement. Broader gauges like the S&P 500 move in reaction to overall economic news or news that hits a whole sector, with ups and downs that can look different depending on what time zone the market is open.
- Cryptocurrency and Commodity Markets
Digital coins such as Ethereum are famous for huge price swings that can begin with a single tweet, a new law, or a sudden change in market mood.
Physical goods like gold or oil dance around according to supply and demand numbers, storage levels, or a protest halfway around the world, and they often make sharp moves right after trade reports hit the wires.
Key Volatility Metrics You Should Know
Wondering how much prices bounce around? Check out these basic numbers traders watch.
| Metric | What It Shows | Why You Care |
| Historical Volatility | Compares past price shifts | Reveals how wild an asset has been lately |
| Implied Volatility | Estimates future price jumps | Tells you what the market thinks is coming |
| Average True Range | Averages the daily high-low spread | Gives a simple daily volatility gauge |
| Bollinger Band Width | Tracks how wide the bands are | Flag moments when calm waters reach a boil |
What Volatility Means for Your Trades
High or low, volatility changes the way you trade:
- Price Movements: Big swings can slip orders into unexpected prices and widen spreads.
- Market Risk: Rapid up-and-down moves cloud the real trend, so watch headlines and volume.
- Trading Costs: After a big news release, fees climb as spreads stretch on every platform.
Navigating Volatility in Your Trading
No trader can escape price ups and downs. Learning what causes volatility-wild news, earnings reports, or big economic numbers-brings confidence to every decision. On our platform, tools such as the Average True Range (ATR) chart and live Bollinger Bands show whether moves are calm, normal, or frantic.
Pair those indicators with the economic calendar and real-time news feed, and you have a road map to spot high-impact moments ahead of time.
Conclusion:
Volatility is part of every trade, pushing some assets up and pulling others down around the world. By knowing where swings come from, how to measure them, and what they can mean for a position, you can steer through our platform with less guesswork.
FAQ
1. What is market volatility?
Market volatility measures how quickly and significantly prices move over time, indicating the level of uncertainty or activity in a market.
2. Why does volatility matter to traders?
Volatility affects trade opportunities, risk levels, and potential returns, making it a key factor when planning entries, exits, and position sizing.
3. What causes market volatility?
Volatility can be driven by economic news, geopolitical events, market sentiment, and sudden changes in supply and demand across financial markets.
4. How can traders manage volatility risk?
Traders manage volatility by adjusting position size, using stop-loss orders, and staying informed through real-time market analysis and tools on FXSI.