Ever wondered how traders figure out if buyers or sellers are really driving a stock’s price? This guide will show you how to use the Cumulative Volume Delta (CVD) indicator. It’s simple, clear, and packed with steps to get you going.
Let’s get started right away!
Kicking Off with CVD Trading
Here’s how to jump into using CVD for your stock trades:
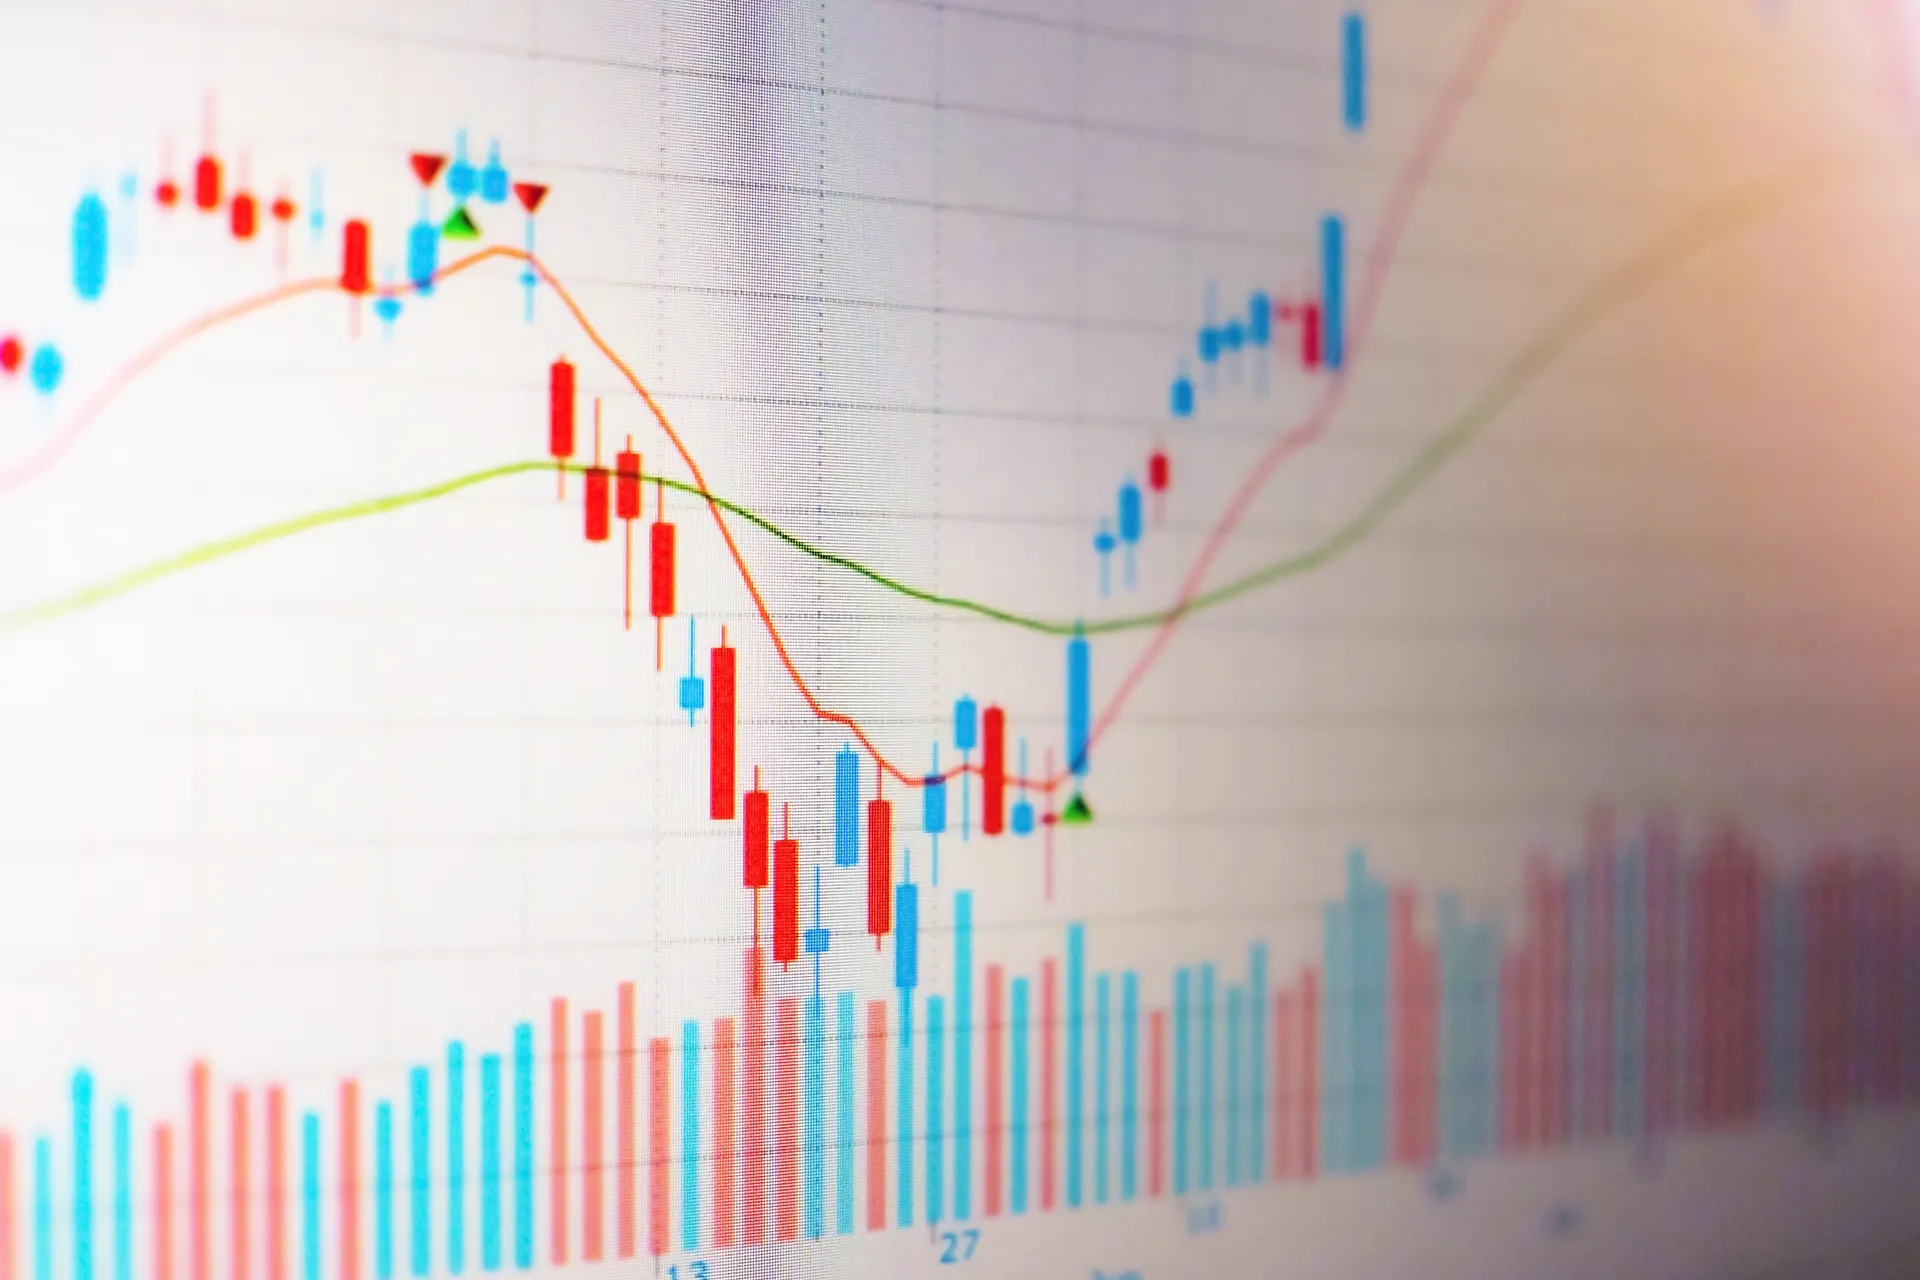
Setting Up Your Chart with CVD
Start with a platform that’s easy to handle, one that offers the CVD indicator—some call it a hidden gem for day traders. Most advanced setups have it, often under volume tools. Toss in some cash you’re fine risking, since trading’s about odds, not sure wins. Additionally, consider integrating the vwap indicator for day trading into your strategy, as it can help you determine the average price a stock has traded at throughout the day, providing valuable insight into market trends. As you refine your approach, remember to stay disciplined and stick to your trading plan, allowing you to maximize your chances of success. With the right tools and mindset, you can navigate the volatile world of day trading more effectively.
Pick a system that keeps you flowing smoothly, with real-time updates so you’re not left behind when CVD shifts. Load the indicator on a stock you like—maybe a tech name or a steady blue chip—and you’re ready to watch the action unfold.
Spotting CVD Buy and Sell Signals
Check your chart and see where CVDs are heading. If it’s climbing—showing more buying volume than selling—it’s a buy signal; prices might rise. If it’s dropping, with selling outpacing buying, consider selling or shorting. Step in when the trend’s clear, letting CVD guide you, not just guessing on a hunch.
- It’s a comfy way to catch who’s in charge—buyers or sellers—right as it happens.
Adjusting Trades with CVD Shifts
When CVD moves, tweak your approach. Hold a buy if it keeps rising, hinting at steady pressure; exit if it flattens or flips down fast. Adjust over minutes or hours, using early signals to feel the stock’s pulse. Keep it steady, learning how volume drives price as you go.
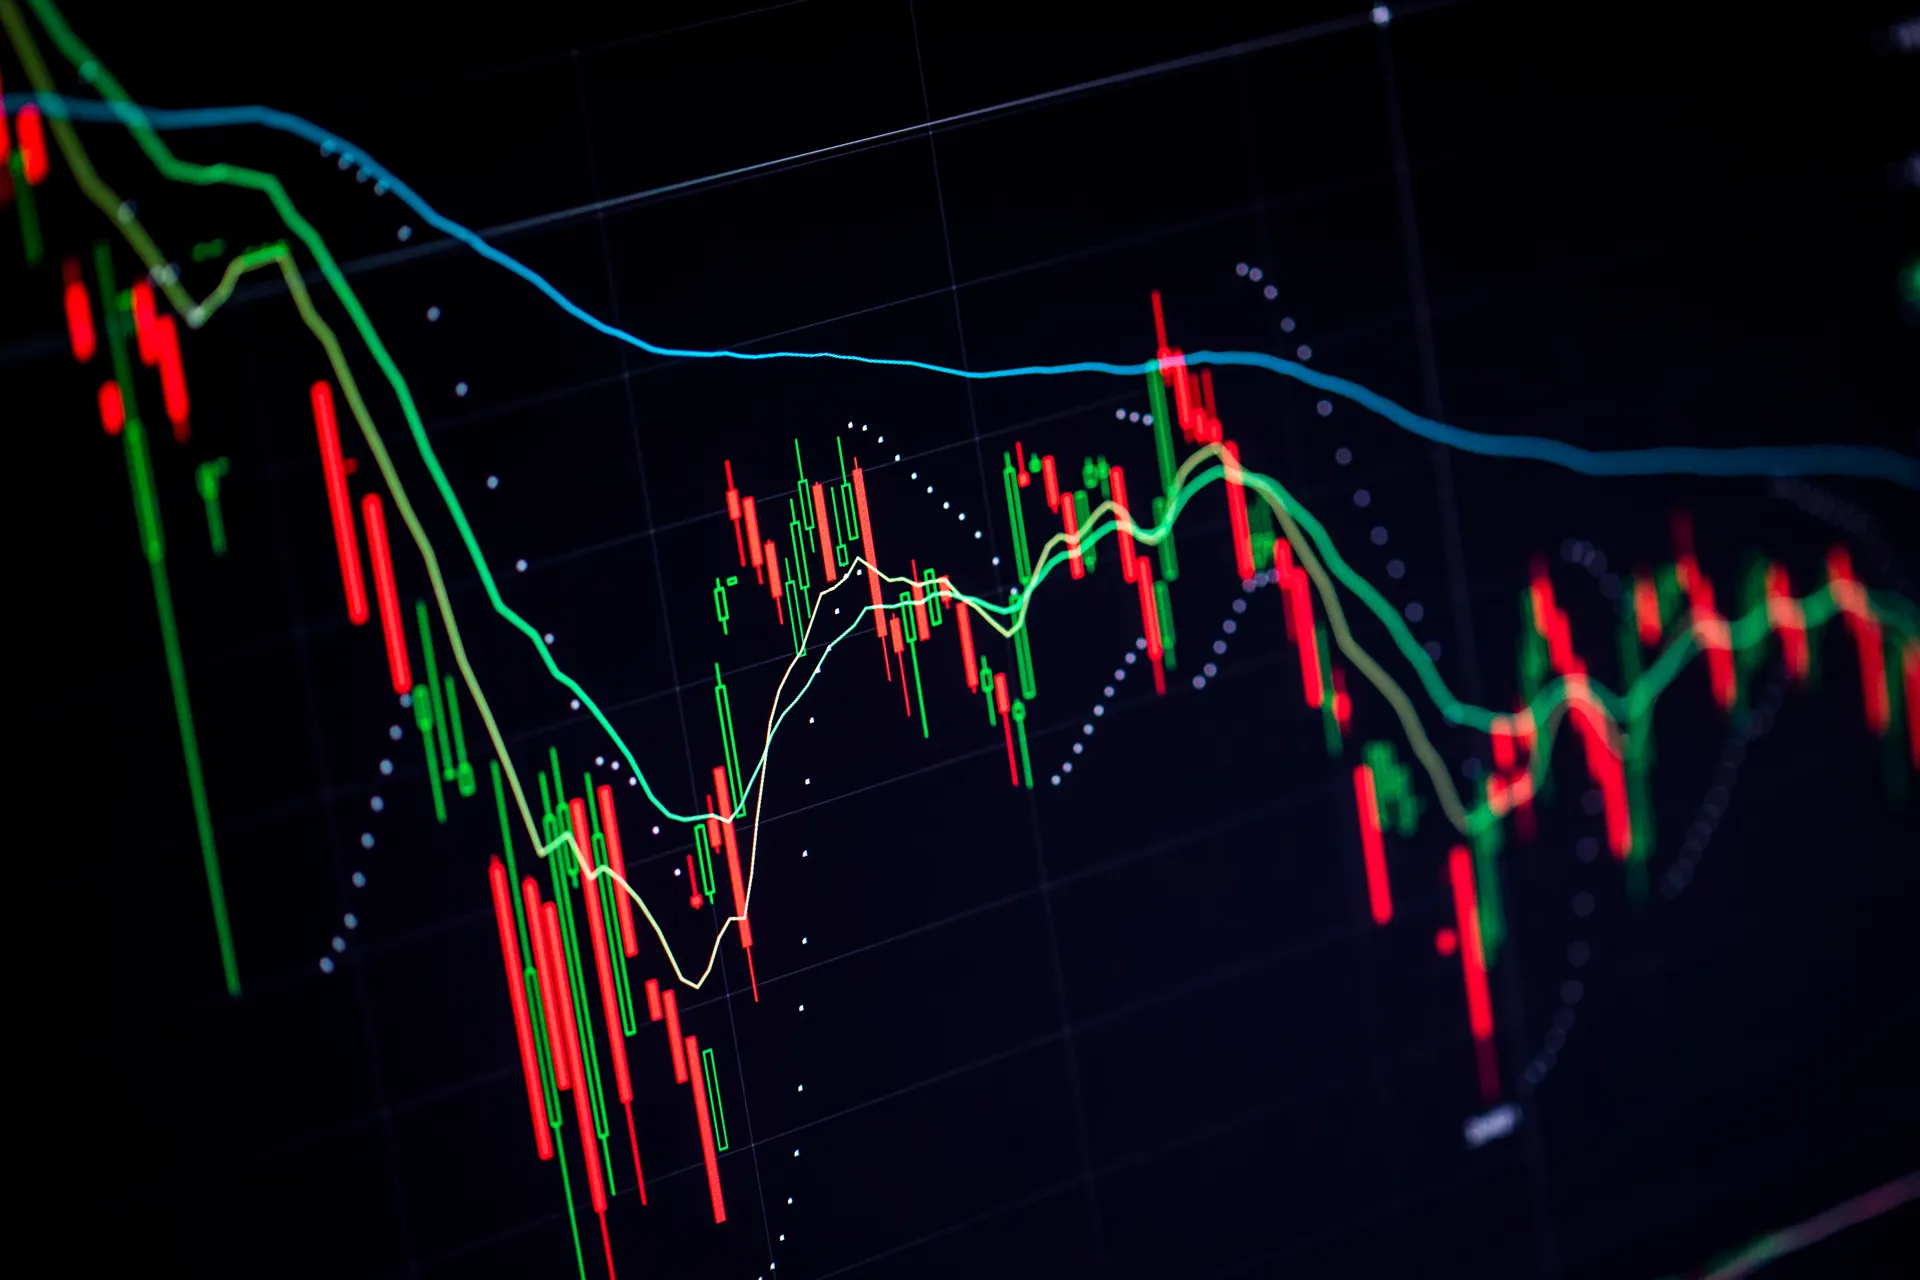
Unpacking the CVD Indicator
Let’s break down what CVD is and why it matters;
What CVD Tracks in Stocks
The Cumulative Volume Delta (CVD) adds up the difference between buying and selling volume over time—think of it as a running score of who’s pushing harder. It’s not just a random line. It’s a neat way to see if buyers are piling in or sellers are unloading, working across all kinds of stocks, from volatile tech plays to quiet dividend payers.
Unlike regular volume, which just shows total trades, CVD splits it out—positive means more buying at the ask, negative means selling at the bid. It’s your peek into the tug-of-war behind price moves, revealing pressure most charts miss. For a newbie, it’s a simple tool to cut through the noise and spot real action.
Why CVD Helps Traders
CVD shines because it shows buying or selling strength before price fully reacts—say, buyers stepping up while price holds steady, hinting at a breakout. It’s a heads-up on momentum shifts, letting you trade with the flow. It’s especially handy in choppy markets, where price alone can trick you.
- This edge makes it a go-to for day traders who need to act fast without second-guessing.
How It Differs from Other Tools
Compared to indicators like RSI or moving averages, CVD focuses on volume, not just price trends. It’s raw—tracking actual trades, not smoothed guesses—giving you a live read on market intent. That’s what sets it apart, offering a fresh angle for your trades.
Tips for Using CVD in Trading
These pointers will help you wield CVD like a pro:
Quick Steps to Get Going
- Watch CVD’s slope; up or down is key.
- Check price action; it ties to volume.
- Pick active stocks; they show more.
Catching Strong CVD Signals
- Look for steep moves; they mean pressure.
- Spot flatlines after runs; they hint at turns.
- Note big trades; they shift the line.
Keeping Risks in Check
- Don’t bet all your cash on one signal; spread it.
- Risk a small piece each time; stay safe.
- Wait for confirmation; shaky moves can flop.
How to Use the Cumulative Volume Delta?
Here’s how CVD shapes your stock trades.
Buying on Rising CVD
When CVD climbs—say, jumping as buyers hit the ask—it’s a green light to buy. It shows demand building, maybe pushing prices up soon. Trade a stock like that when volume backs the rise, giving you a solid shot at catching the upswing.
Note: Think of a tech name spiking on news—CVD might surge as traders pile in, letting you ride the wave early.
Selling on Falling CVD
If CVD drops—selling volume taking over—it’s a sell or short signal. Prices might lag, but the pressure’s there, hinting at a fall. Jump in when it’s steady down, like energy stocks fading on a sector dip, offering a quick play as sellers dominate.
Handling Divergences with CVD
Sometimes CVD and price split—price rises, but CVD falls, warning of a fade. Trade these twists by selling into the hype or buying a dip when CVD rises but price lags. It’s your edge for spotting turns before they hit.
What Fuels CVD Movements?
Let’s look at the bigger forces behind CVD:
Trader Action and Volume
CVD moves with who’s trading—big buyers can spike it up, heavy sellers drag it down. A news pop, like an earnings beat, might flood buying volume, lifting CVD fast. It’s the market’s pulse, showing intent in real time.
Market Mood and Events
A bullish day might keep CVD climbing as stocks rally; a bearish one could sink it across sectors. Fed news or jobs data can flip it too—rate cuts might juice buying, hikes might spark selling. It’s tied to the vibe traders feel.
Stock-Specific Shocks
A single stock’s story—like a product launch—can jolt its CVD, even if the market’s flat. Sector shifts, say tech booming, play in too. These swings keep CVD lively, giving you trade cues.
Timing Trades with CVD
Timing’s crucial—here’s how CVD helps you nail it:
Early Moves at Open
At the bell, CVD might spike—buyers rushing in could lift it fast, hinting at a run. Trade quickly if it’s sharp, like a 10% volume edge in minutes. It’s your early window to catch the day’s tone.
Midday Pressure Points
Through the day, CVD might peak or trough—say, climbing as price tests a high, showing strength. Jump in when it aligns, maybe holding a buy as buying builds over an hour. It’s the meat of your trading window.
Late-Day Wrap-Up
Near close, CVD might flatten or flip—selling picking up could drop it, signaling an exit. Adjust as it settles, watching if volume fades or spikes late, like a last rush at 3 PM. This wrap-up sets your final play.
Quick Recap:
This guide’s shown you how to use the Cumulative Volume Delta (CVD) indicator for stocks, giving you a clear way to spot volume pressure. You’ve got the steps and tips to dive in without a hitch. Good luck out there!
FAQ
What is the CVD indicator?
Cumulative Volume Delta tracks the difference between buying and selling pressure over time, helping traders assess underlying market sentiment.
How does CVD help with stock analysis?
It reveals whether buyers or sellers are dominating, even when price appears stable, offering insight into potential future moves.
When is CVD most useful?
CVD is particularly helpful during breakouts, reversals, or consolidation phases where hidden buying or selling pressure may exist.
Can CVD improve trade timing?
Yes, combining CVD with price action and key levels can improve entry timing and confirmation of market direction.