In the complicated world of commodities trading, traders and investors have had to deal with an enduring dilemma: do you believe in technical analysis, or do you bet on fundamental analysis? These two dominant methodologies present alternative, often complementary, views on how commodity markets work. Understanding the key principles, strengths, and limitations of each can help improve your advantage in the market that is fueled by numbers and stories.

Understanding the Foundations: What Are We Really Comparing?
At its most basic level, the case is about the way that one interprets, and predicts, price action in commodities like gold, oil, maize, or platinum — commodities that are important not only to localized economics but global supply chains as well.
Technical analysis as it relates to market psychology
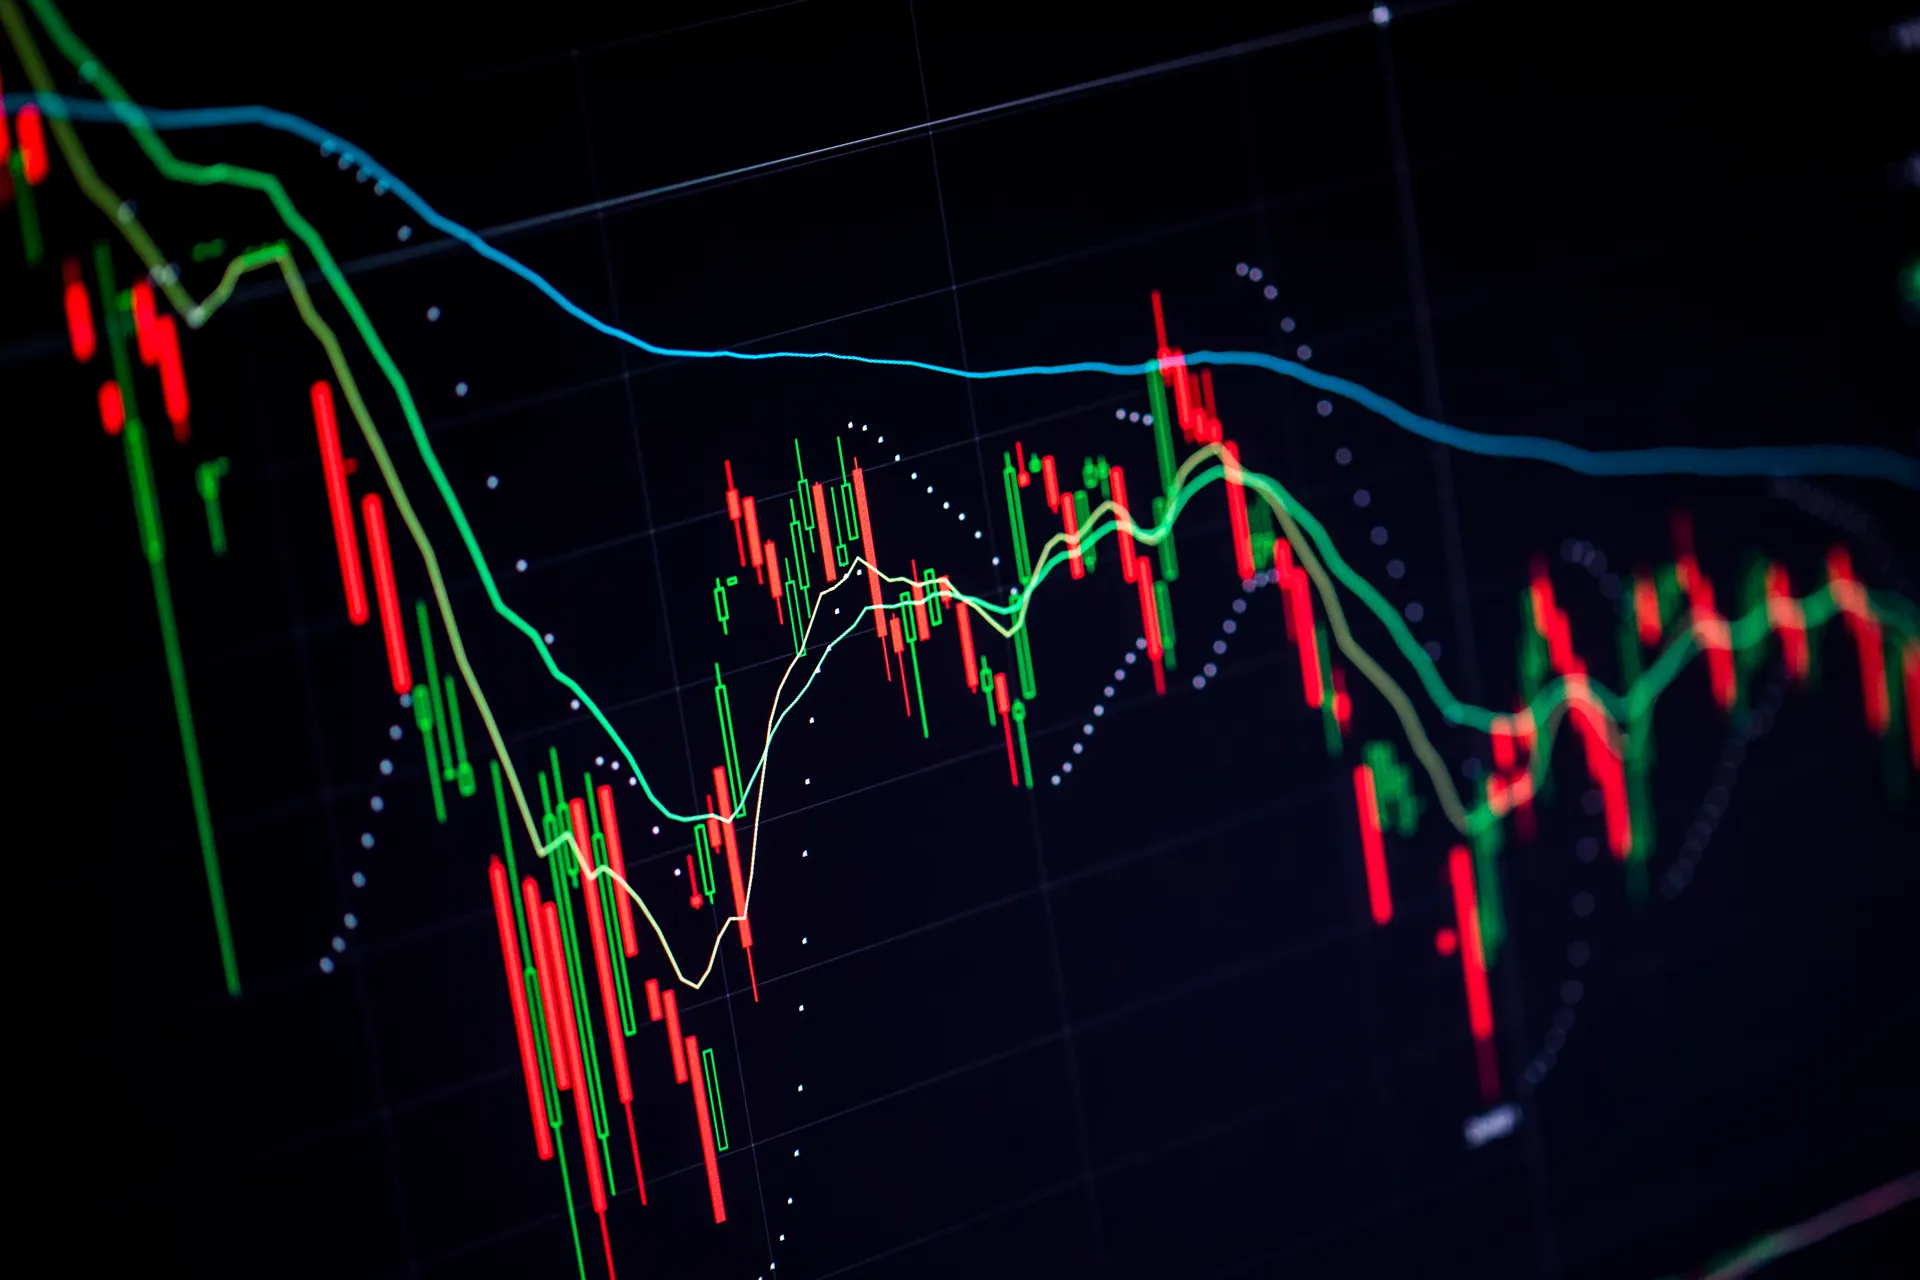
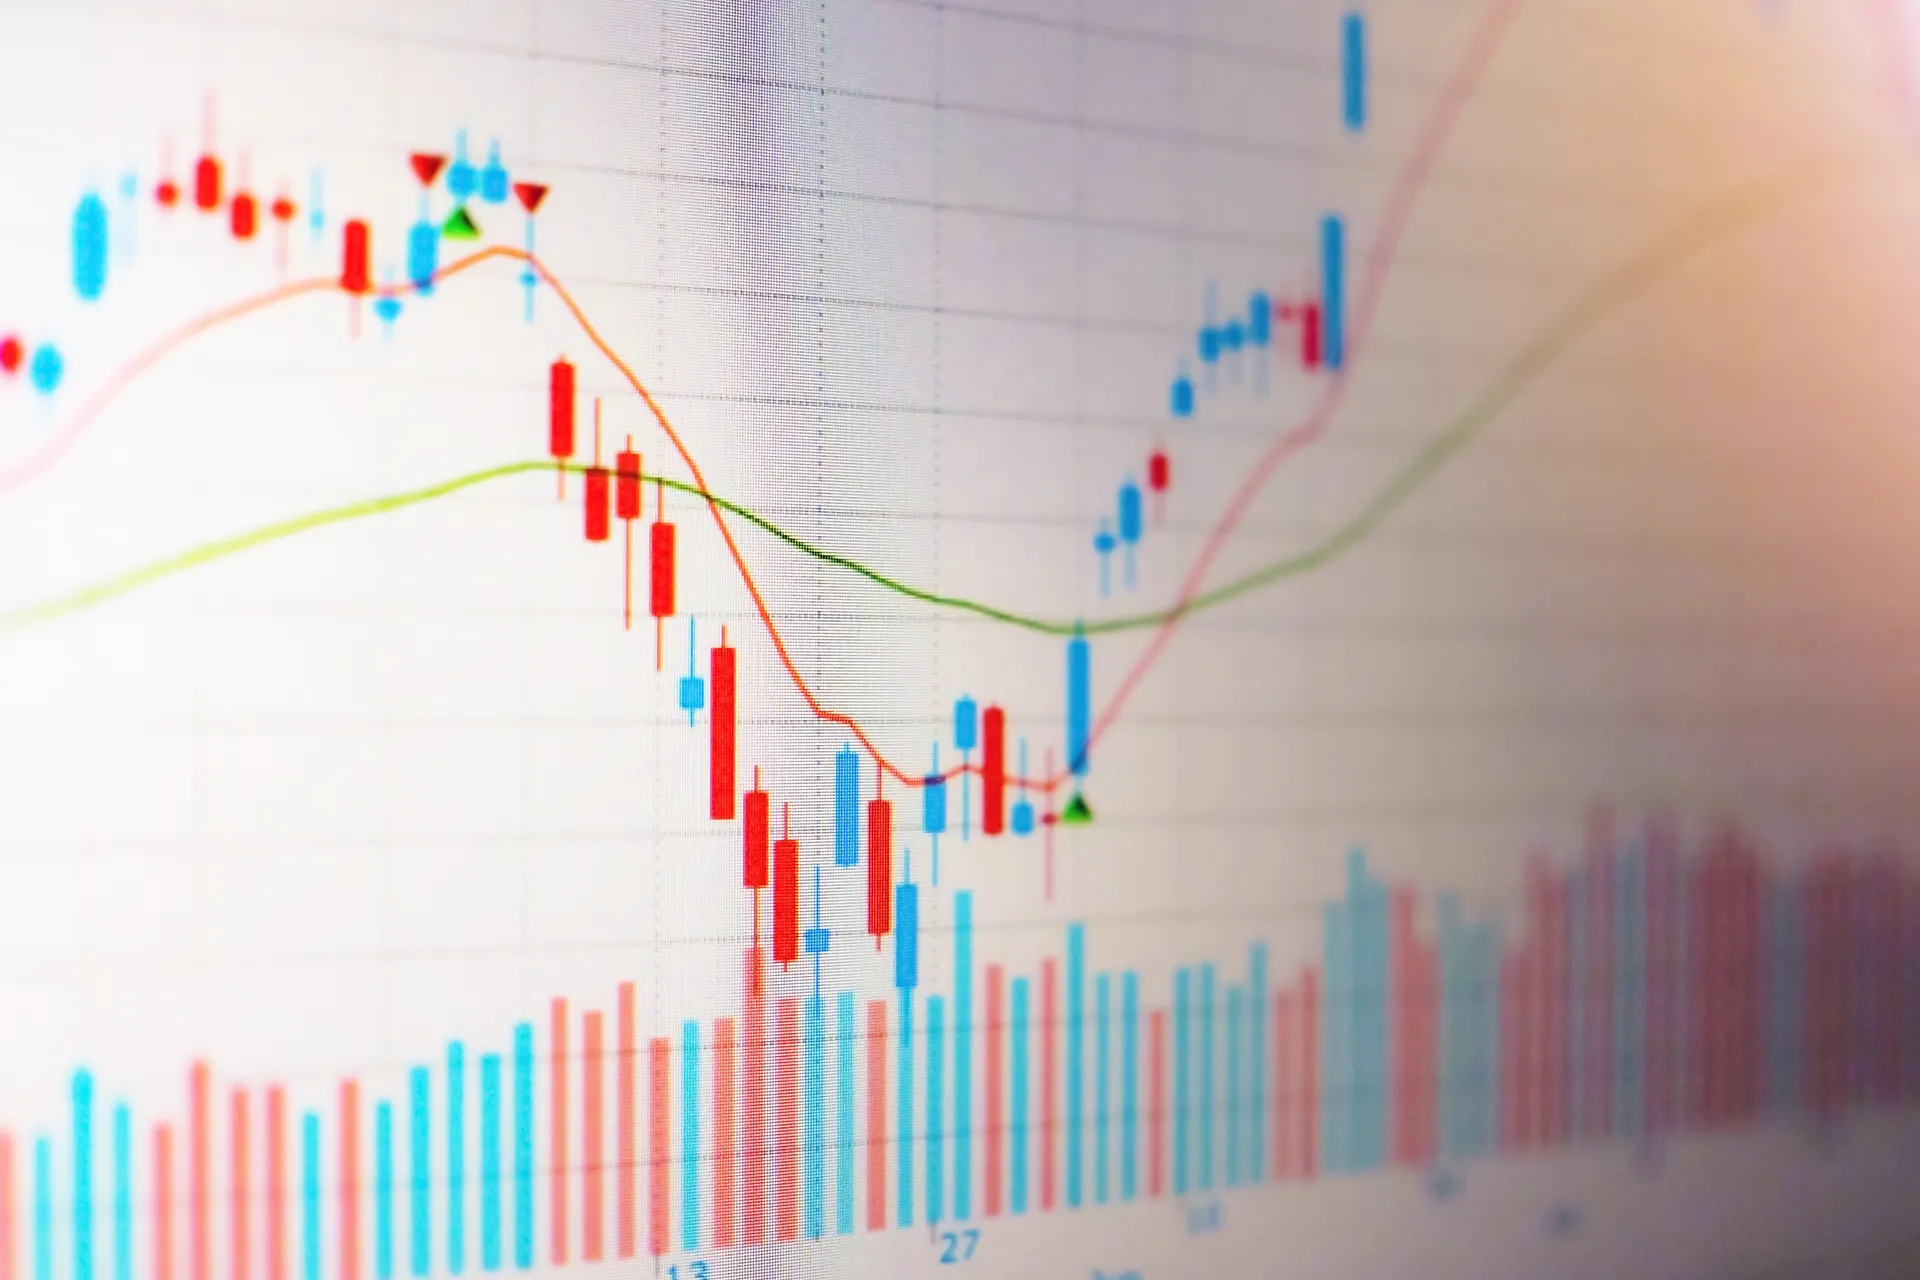
Technical analysis involves the study of historical market data, primarily price and volume, in hopes of forecasting future price action. Chartists who employ this method base their decisions primarily on charts, patterns, and technical indicators such as moving averages, RSI (Relative Strength Index), MACD (Moving Average Convergence Divergence), and Fibonacci retracements.
It is based on the assumption that everything that is known is reflected in the price, and prices go according to patterns that will occur again in the future according to the psychology of investors.
Fundamental analysis: the economic compass
In contrast, fundamental analysis digs in deep into macroeconomic, geopolitical, as well as sectoral specific determinants of commodities’ supply and demand. Such include:
- Weather (agricultural commodities’ key driver)
- Mining output reports
- Currency fluctuations
- Government policy (such as trade tariffs)
- Inventories and stockpiles (e.g. EIA crude oil inventories)
- Global consumption patterns
The underlying assumption here is that a commodity has an inherent value, and prices will eventually move towards this value in the long term.
Head-to-Head: Key Differences at a Quick Glance
| Feature | Technical Analysis | Fundamental Analysis |
| Regions of focus | Price movements, trends, volume | Economic indicators, supply-demand dynamics |
| Time Horizon | Short- to medium-term | Medium- to long-term |
| Tools Used | Charts, trendlines, indicators | Reports, news, economic data |
| Main Users | Day traders, swing traders | Analysts, institutional investors, hedgers |
| Speed of Insights | Immediate | Delayed (requires analysis of external data) |
| Bias Toward | Market sentiment | Real-world economic realities |
When to Apply Technical Analysis: Advantages as well as Best Situations
Technical analysis is effective in highly liquid, volatile markets. It is most effective in the following situations:
- Short-term trading: Intraday or weekly strategies are supported through timing of entry and exits.
- Market Noise Filtering: Charts can help uncover patterns within the noise of breaking news.
- Quantitative methods: Algorithmic as well as automatic processes generally rely on technical rules.
- Charts are objective, as they keep the trader independent of fear and greed.
✅ Key Takeaway: Technical analysis helps traders with “what is happening” rather than “why it’s happening.”
When Fundamental Analysis takes the driver’s seat
Fundamental analysis is the preferred method for those investors who hold the view that factual information controls price, even if the impact is indirect.
- Long-term investment choices: These are utilized by institutions holding significant commodity positions.
- Supply Chain Disruptions: Visibility into events like drought, conflict, or policy change allows for early warning.
- Macroeconomic Themes: Inflation, interest rate, or global energy transition experts rely on this sort of analysis.
- Producer/Buyer Risk Management: Farmers, mining houses, and companies hedge on fundamentals, but not on price trends.
✅ Key Takeaway: Fundamental analysis gives the “why” – required for conviction building

Which Is Best For You? It depends on your strategy and your time horizon
The decision between fundamental and technical analysis is not either-or. Most profitable commodity traders in South Africa and the world usually blend the two in a hybrid approach.
👇 Keep these in mind while making your move:
1. Your Trading Timeframe
- Short-term? Use technicals.
- Long-term positioning is founded on fundamentals.
2. Your Access to Data
- Yes, I do have access to sound macroeconomic analysis.
- Do you have experience reading charts as well as technical indicators?
3. Your Trading Psychology
- Do you like making quick trades with predetermined exit points?
- Or do you prefer taking positions based on broader macro trends?
Bringing Them Together: The Intelligent Trader Guide
You don’t need to do one or the other. This is what experienced traders do:
- Use simple analysis to predict an expected market direction
- Use technical analysis for identifying particular entry as well as departure points
For example, an El Niño South African maize trader would expect bad harvest due to El Niño (fundamentals-based view), wait for technical breakout above a significant resistance level before their trade is confirmed.
Major Takeaways to Keep in Mind
✅ Fundamental analysis informs us “why”, while technical analysis informs us “when”.
✅ Integrate both methods for the overall solution
✅ Your approach should be based on your objectives, risk appetite, and market insight.
FAQs: Your Questions Answered
What is technical analysis in commodity trading?
Technical analysis focuses on price charts, patterns, and indicators to identify trends and potential entry or exit points in commodity markets.
What is fundamental analysis in commodities?
Fundamental analysis examines supply, demand, economic data, and geopolitical factors that influence commodity prices over time.
Which approach is better for traders?
Both approaches can be effective, and many traders combine technical and fundamental analysis to gain a more complete market perspective.
Can traders use both methods together?
Yes, combining chart analysis with economic and supply-demand insights often improves decision-making and overall trading strategies.
Last but Not Least: Find the Ideal Balance For Yourself
Commodity markets are as advanced as they are volatile. For the South African investor or trader, the ability to interpret charts along with headlines is a possible game-changer. Hedging rand volatility, staying one step ahead of mining production, or monitoring global energy trends – having access to both technical as well as fundamental insight is no longer optional. It is necessary. You don’t have to be on either side. Being able to balance conviction and timing is what the most successful traders comprehend. And that is the real edge in trading in commodities.