

Table of Contents
Trading experts have long relied on Japanese candlestick analysis to decode market behavior, with certain patterns proving remarkably insightful. In this complete guide to candlestick patterns, we’re about to unveil the key takeaways, how to read them, and master their formations.
When you spot formations like the bullish engulfing or three white soldiers on your charts, you’re looking at historically reliable signals – research suggests they can predict upward moves about 70% of the time. Smart traders don’t just rely on these patterns alone though. The real magic happens when you layer in other tools: key support and resistance zones, technical indicators, and analysis across different timeframes.
Whether you’re trading stocks, crypto, or forex, these patterns work across all markets. As you get more comfortable spotting them, you’ll start to see how they fit into the bigger picture of how markets move.
Guide to Candlestick Patterns – Key Takeaways:
Japanese rice traders in the 1600s came up with a clever way to track market moves – what we now call candlestick patterns. These visual price snapshots, with their bodies and shadows, show you how buyers and sellers are battling it out. Today’s traders take these time-tested patterns and pair them with modern tools like moving averages and RSI to get an even sharper read on market moves.
Bullish patterns such as engulfing and three white soldiers suggest potential upward movements, with success rates around 62%. Conversely, bearish formations like evening stars and three black crows indicate possible downward trends, especially when confirmed by high trading volume. Different markets exhibit unique candlestick characteristics; cryptocurrencies often show rapid formations, while stocks tend to display more gradual patterns.
Reading Candlestick Charts: Your Guide to Market Moves
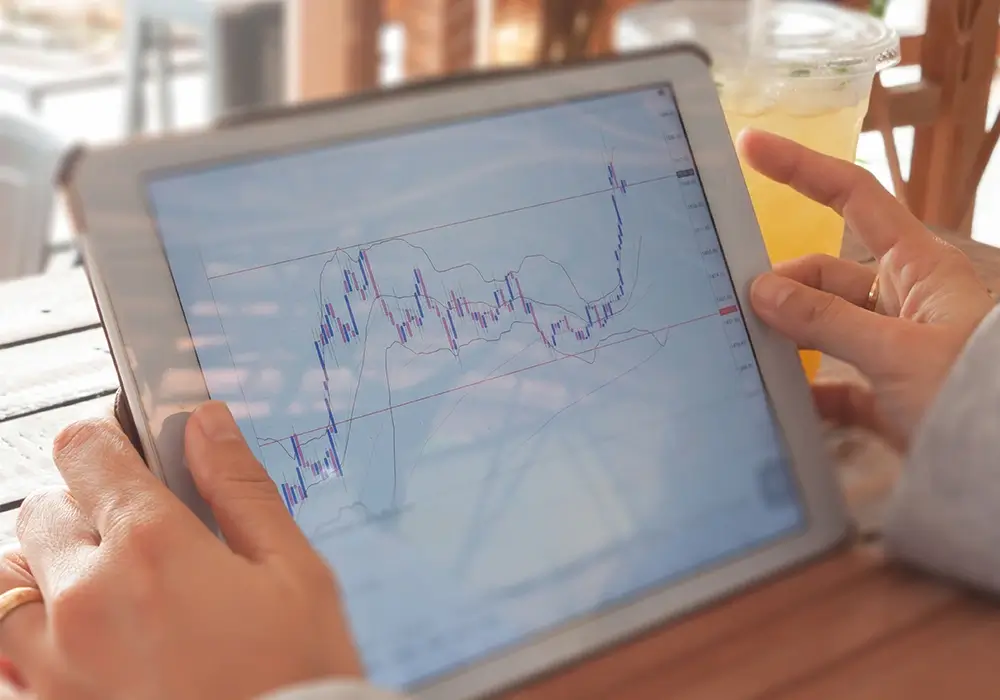
Candlestick charts make reading the markets surprisingly simple. Traders love them because they turn complex price movements into clear visual patterns that anyone can learn to spot. Each candle on your chart tells its own story – each candlestick represents a specific time period, where a bullish candle shows buyers winning the battle, while a bearish candle indicates sellers dominated that session.
What makes these charts really powerful is how much information they pack into each candle. The shapes, sizes, and those little lines extending from the top and bottom can tip you off to possible market turns or price levels where other traders might jump in. It’s like having a market roadmap that helps you spot opportunities and make smarter trading decisions.
Originating in 17th-century Japan, this time-tested method has proven invaluable across various financial markets.
Pattern recognition strengthens as you learn to interpret the interplay between these elements. The system gained widespread recognition when Steve Nilson introduced these techniques to Western traders through his influential work.
Essential Bullish Candlestick Patterns for Trading Success
To enhance your trading strategy, focus on these reliable bullish candlestick patterns that signal potential upward price movements.
Some of the most powerful candlestick patterns emerge when a trend reversal is likely. When a bullish reversal pattern is formed, it often signals a potential turning point in the market.
Four patterns stand out for their high success rates: the bullish engulfing pattern, three white soldiers, and the rising three methods. Each provides unique insights into market trends and buying pressure.
When you see a small red candle followed by a much bigger green one that completely covers it, that’s the market telling you buyers are stepping in with force. Traders call this a bullish engulfing pattern, and it’s pretty reliable – it works out about 62% of the time when you’re looking for market turns.
Three white soldiers appear as three consecutive green candles, each closing higher than the previous, reflecting sustained upward momentum. Traders often combine these patterns with technical indicators to improve their reliability.
The rising three methods pattern shows a temporary pause in an uptrend, with three small red candles contained within two larger green ones, reaffirming price strength.
These patterns, when identified correctly, can serve as valuable tools for predicting bullish market shifts.
Mastering Bearish Candlestick Formations
When markets are about to drop, certain patterns tend to show up again and again. Take the bearish engulfing pattern – it’s like a warning flag, but you’ll want to check what the overall market is doing before making any moves. Smart traders don’t just look at these patterns in isolation; they watch where prices typically bounce or stall (support and resistance) and always keep their risk in check.
Some patterns are pretty dramatic, like the three black crows – imagine three long red candles in a row, showing sellers are firmly in control. Then there’s the evening star, which often pops up right at market tops, giving you a heads-up that buyers might be running out of steam.
The hanging man pattern is another key candlestick to watch for – it often appears at market tops and can signal a potential reversal.
High trading volumes can reinforce the reliability of bearish signals, making them more trustworthy.
For optimal results, integrate these patterns with other technical indicators to enhance decision-making.
Combining Candlestick Analysis With Technical Indicators
When you blend candlestick patterns with technical indicators, you get a clearer picture of market moves. It’s like having multiple weather forecasts before planning a trip – the more sources agree, the more confident you can be. Moving averages help you spot the market’s direction, backing up what your candlestick patterns suggest. Add in tools like RSI or Stochastic, and you can tell when a market’s getting stretched too far in either direction, making your candlestick signals even more meaningful.
Fibonacci retracement levels provide additional validation when patterns emerge near key price zones. Higher timeframe patterns offer improved clarity when analyzing market trends.
Additionally, integrating support and resistance levels with volume analysis sharpens the precision of entry and exit points.
These tools, when used together, create a cohesive and reliable approach to technical analysis.
Real-World Applications Across Different Market Types
Candlestick patterns exhibit unique behaviors across different markets, including stocks, cryptocurrencies, and forex pairs.
A continuation pattern might look similar across different markets, but its reliability can vary significantly.
Each market type operates under distinct conditions that influence pattern formation. Stock markets, with their regulated trading hours, tend to produce more gradual patterns.
Cryptocurrencies, trading 24/7, display heightened volatility, leading to rapid and unpredictable formations. Experienced analysts like Patricia Elbaz emphasize the importance of recognizing Doji star patterns when trading across multiple instruments. The presence of three white soldiers often signals strong bullish momentum in crypto markets.
Forex markets often reveal clearer patterns during high-liquidity periods, such as the overlap of European and American trading sessions, which amplify trading signals. Understanding these variations can enhance decision-making across diverse trading environments.
Stocks Vs Crypto Patterns
Candlestick patterns function as universal tools for technical analysis, yet their application and reliability differ between stock and cryptocurrency markets.
Market sentiment and trade signals vary due to distinct characteristics like 24/7 trading in crypto, which leads to more volatile pattern formations compared to stocks.
Differences in trading volume and confirmation periods for patterns like bullish and bearish engulfing also affect reliability.
Recognizing these distinctions allows traders to adjust strategies, tailoring actions to each market’s unique environment and volatility levels.
FOREX Market Trading Dynamics
The FOREX market offers a unique trading environment with distinct characteristics for pattern recognition, shaped by its 24/5 operation and high liquidity. Candlestick patterns gain heightened importance, as they reflect the constant interplay of global sessions, each with varying trading volumes and key patterns.
|
Session |
Trading Hours |
Volume |
Key Patterns |
|
Asian |
23:00-08:00 |
Moderate |
Doji, Spinning Tops |
|
European |
08:00-16:00 |
High |
Engulfing, Three White Soldiers |
|
US |
13:00-22:00 |
Very High |
Hammer, Evening Star |
|
Overlap |
13:00-16:00 |
Peak |
Pin Bar, Marubozu |
Focus your technical analysis on identifying trends during high-volume periods, integrating market sentiment and momentum indicators to detect bullish or bearish reversal signals. Effective risk management is crucial, given the leverage potential inherent in FOREX trading.
Advanced Pattern Recognition and Trading Strategies
Successful trading depends on mastering pattern recognition, particularly advanced candlestick formations, to enhance market analysis and guide optimal entry and exit decisions.
Combining bullish and bearish reversal patterns with disciplined risk management ensures a strategic approach. Confirm patterns using multiple technical analysis tools, study advanced formations like Morning Stars and Shooting Stars across various timeframes, and maintain clear stop-loss levels to manage trades effectively.
Frequently Asked Questions
How Long Should I Practice Chart Patterns Before Trading Real Money?
Practice reading candlestick patterns for 3-6 months on a demo account. Achieve consistent profitability and confidently identify patterns across multiple timeframes before trading with real money.
Which Timeframes Are Most Reliable for Specific Candlestick Pattern Analysis?
Daily and weekly timeframes offer the most reliable data for analyzing candlestick patterns. These intervals reduce market noise and deliver clearer, more trustworthy signals, helping traders make informed decisions efficiently. Shorter timeframes often introduce excessive volatility, which can distort pattern interpretation. By focusing on longer durations, traders gain a balanced view of price action while maintaining semantic consistency and accuracy in their analysis.
Do Candlestick Patterns Work Differently in Crypto and Stock Markets?
While traders can spot the same candlestick patterns in both crypto and stocks, there’s a key difference in how reliable they are. Crypto markets never sleep, and they tend to swing much more wildly than traditional stocks. This means you’ll need stronger confirmation signals before jumping into a trade based on these patterns. Think of it like driving the same car on two different roads – one smooth highway, one bumpy mountain path. You’ll need to adjust your approach even though you’re using the same vehicle.
What Percentage of Identified Candlestick Patterns Actually Result in Predicted Movements?
About 40-60% of identified candlestick patterns result in their predicted price movements, though success rates depend heavily on prevailing market conditions and the use of confirmation signals to validate patterns.
Can Candlestick Patterns Be Effectively Automated Through Algorithmic Trading Systems?
Automating candlestick patterns through algorithmic trading requires robust pattern recognition, volume analysis, and risk management to filter false signals effectively.
Conclusion:
Once you spend time with charts, these candlestick patterns start jumping out at you. It’s like when you learn a new word and suddenly hear it everywhere – you’ll begin seeing these market signals all around. They’re most useful when you match them up with your other trading tools, giving you a better feel for potential moves.
At first, you might need to look carefully to spot these patterns. But after a while, you’ll catch yourself thinking “hey, that looks like a setup” without even trying. That’s when trading gets really interesting – when you can read the market’s mood almost at a glance. Keep at it, and you’ll develop an almost sixth sense for when things are about to move.