For beginners stepping into trading, the trading volume analysis offers a clear way to understand how much activity backs a price move, revealing whether it’s likely to keep going or fade away. It’s about looking at the number of shares or contracts traded to gauge the strength behind market shifts, giving you a heads-up on what might happen next.
This guide explains how volume works and shows simple strategies to use it, helping new traders make smarter calls without guessing in the dark.

What Volume Analysis Tells You About the Market
Volume analysis looks at how many trades happen over a certain time, showing whether buyers or sellers are pushing hard or just sitting back, which paints a picture of where prices could head.
For someone new to this, it’s a tool that cuts through the clutter of price jumps, letting you see if a big move has real force or if it’s just noise that won’t last long.
By tracking this, traders get a sense of the market’s mood, making it easier to decide when to buy, sell, or wait it out based on solid clues instead of random hunches.
How Volume Ties to Price
When prices rise or fall, volume shows if there’s enough action to support it, acting like a signal that confirms whether the trend’s got staying power or might peter out soon. A price climbing with lots of trades behind it suggests strong buying interest, hinting it could keep rising, while the same move with low volume might mean it’s weak and ready to reverse.
Understanding this link helps beginners avoid jumping into trades that look good but lack the muscle to hold up over time.
Where Volume Data Comes From
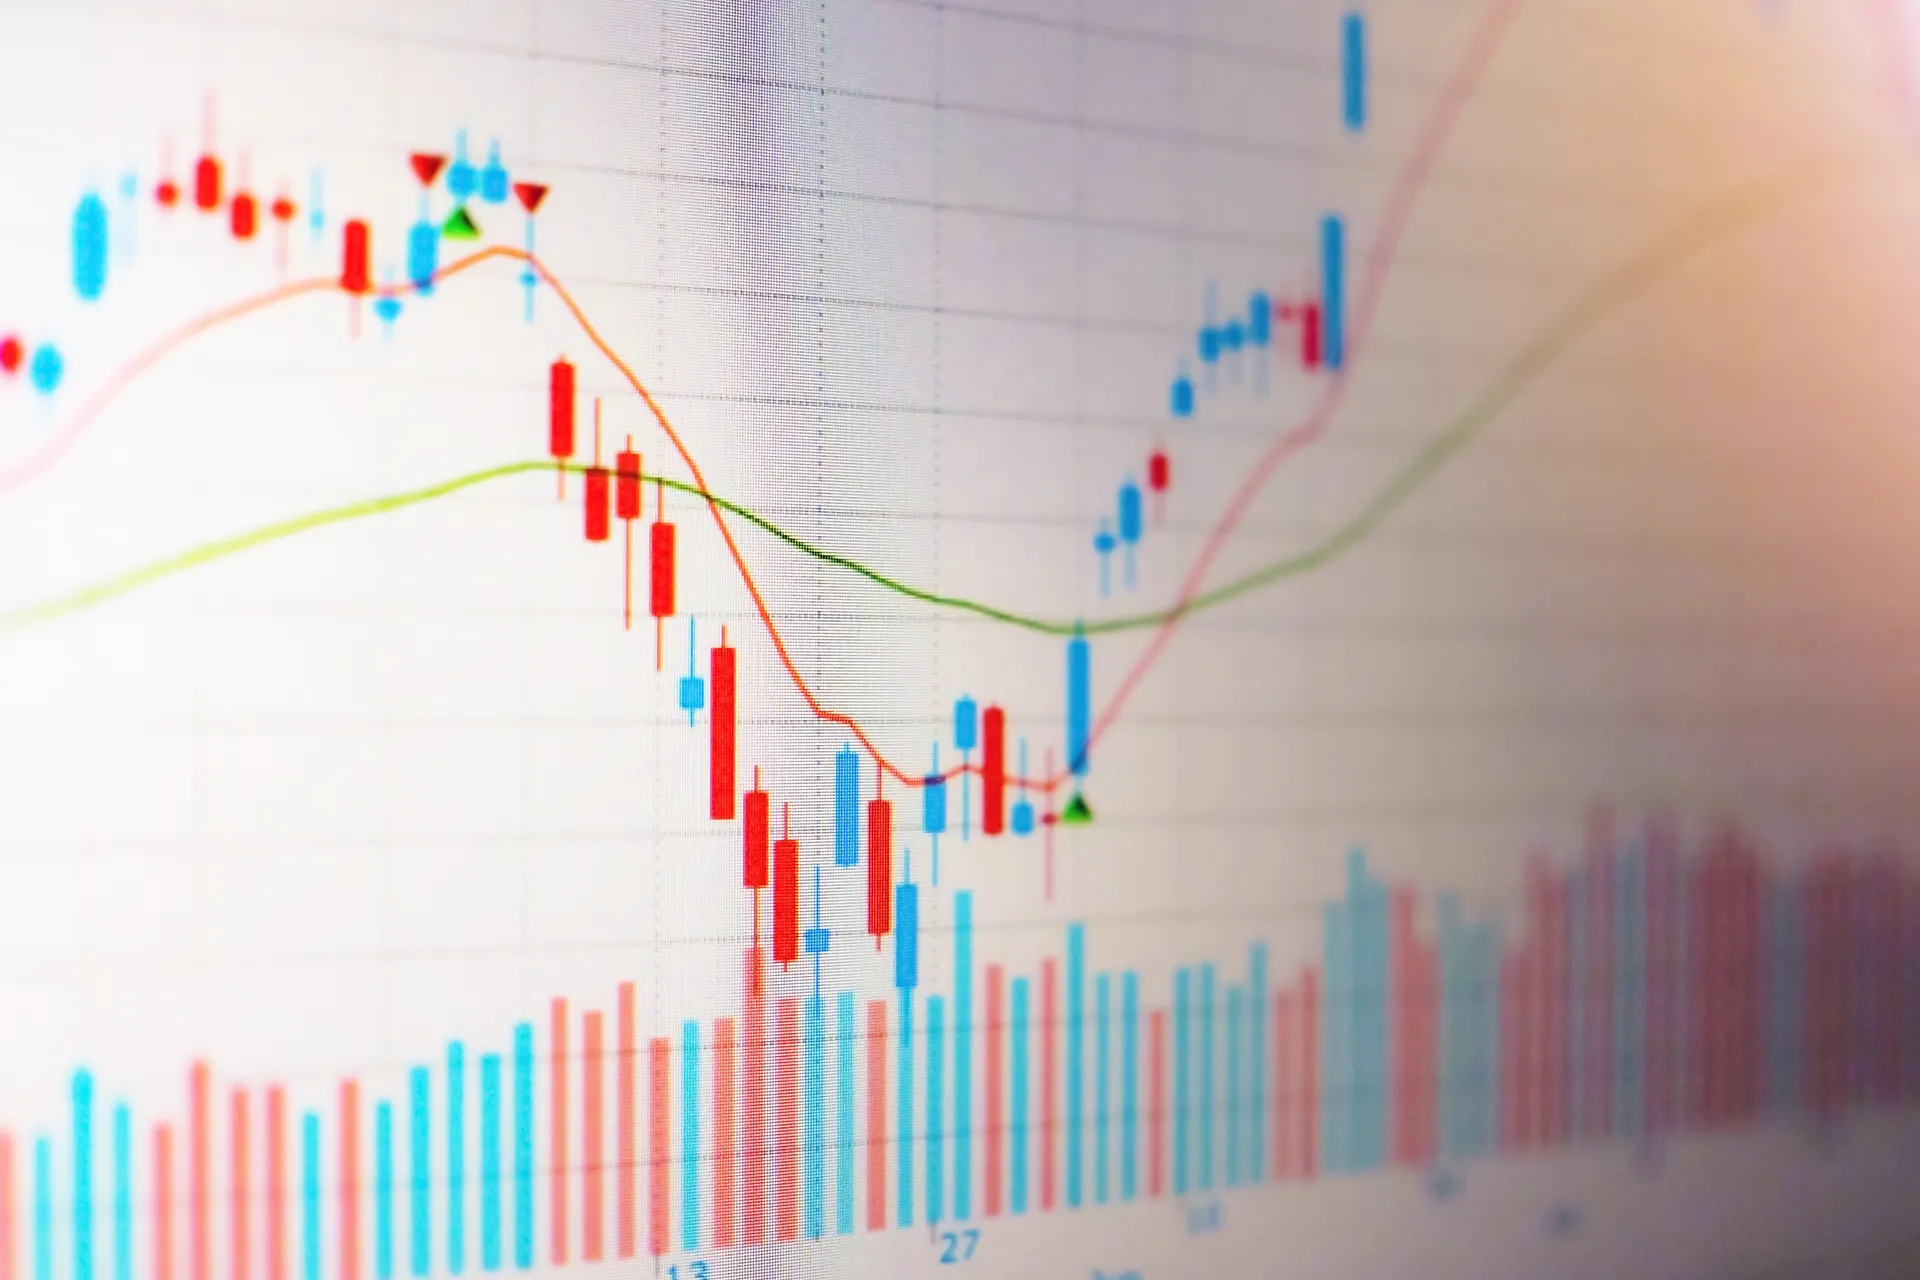
You’ll find volume numbers right on your trading platform or chart, usually as bars under the price line, tracking how many shares or contracts swapped hands each day or hour. Most markets—like stocks, futures, or even crypto—report this live, so you’re seeing what’s happening as it unfolds, giving you a real-time peek at trader activity. For new folks, knowing it’s this easy to spot means you can start using it without digging through complicated reports or fancy setups.
Why Volume Matters in Trading
Volume’s a big deal because it shows the weight behind a price change, letting you judge if a breakout’s legit or if a drop’s just a blip before things turn around. For beginners, this means you’re not stuck relying on price alone, which can trick you when it moves without much going on since volume adds that extra layer to check if the market’s serious. It’s like a truth detector, helping you sort real trends from fake ones so you’re not left holding a trade that’s about to flop.
- Spotting Strong Trends
When volume ramps up alongside a price move, it’s a sign that lots of traders are in on it, pushing the trend further with real momentum you can trust to stick around.
If a stock’s climbing and the volume bars keep growing, it’s likely that buyers are piling in, suggesting the uptrend’s got legs to carry it higher over time. Beginners can lean on this to ride a wave that’s solid, avoiding those shaky moves that fizzle out quickly when the action’s thin.
- Catching Reversals Early
Volume can also tip you off when a trend’s losing steam, showing a slowdown in trades that hints the market’s ready to flip the other way before prices even show it. If a price keeps rising but volume starts dropping off, it might mean buyers are backing away, setting up a drop you can get ahead of by selling early.
For new traders, watching this shift gives you a chance to dodge losses or jump in on the next move, using volume as your early warning system.

Trading Volume Analysis: Key Strategies to Predict Moves
Halfway through grasping volume analysis, it’s clear this approach hands beginners some practical ways to read the market, blending volume signals with price to guess what’s coming next.
Strategies like watching breakouts or fading weak moves use volume to guide your trades, keeping you on the right side of the action without overcomplicating things.
Breakout Confirmation
One solid move is checking volume when prices bust through a key level—like a high or low they’ve hit before—to see if the breakout’s got enough juice to keep rolling or if it’s a dud.
A price jumping past resistance with a big volume spike says traders are all in, making it a safer bet to buy since it’s likely headed higher, while low volume on that same break might mean it’s a fakeout ready to fall back.
Tip: Beginners can use this to jump on real breakouts, skipping the ones that don’t have the push to last.
Fading Low-Volume Moves
Another trick is fading, or betting against, price moves that look big but show tiny volume since they often lack the force to hold up and reverse quick. If a stock drops hard but the volume’s barely there, it might just be a few sellers panicking, so buying in could catch the bounce when others step back in.
For newbies, this flips the script on weak moves, letting you trade against them with confidence when volume says they’re not serious.
- Low Volume Drop: Thin trades on a fall can signal a quick rebound, good for a buy.
- High Volume Push: Heavy trades on the rise mean it’s strong, worth riding up.
- Stalling Sign: Volume drying up on a climb hints it’s topping out, time to sell.
Mixing Volume with Other Signals
Layering volume with extra tools sharpens your view, making sure you’re not banking on one thing alone when you’re still learning the ropes.
Pairing it with stuff like moving averages or support lines helps confirm what volume is hinting at, cutting the odds of chasing a move that’s about to turn sour. For beginners, this mix builds a sturdier setup, giving you more to lean on so your trades aren’t just a roll of the dice.
Volume and Moving Averages
Tying volume to a moving average shows if a trend’s got real backing, blending the smooth line with trade action to nail down your next step. A price crossing above the average with volume spiking says the uptrend is legit, while a cross below with low volume might mean it’s not worth selling yet. This combo keeps new traders from jumping too soon, matching the volume’s story with where prices are trending.
Volume at Support or Resistance
Checking volume when prices hit a support floor or resistance ceiling tells you if it’ll hold or break, guiding you on whether to buy, sell, or wait it out. Big volume at support with prices bouncing says buyers are stepping up, a good buy spot, but if it breaks with heavy trades, it’s a sell signal as the floor caves. Beginners can use this to time trades at key spots, letting volume show if the level’s got fight left.
Conclusion:
The trading volume analysis gives beginners a powerful way to peek into market moves, using trade activity to spot trends or turns before prices spell it out.
Breakouts with big volume or fades on weak action, paired with averages or key levels, help you trade with more know-how instead of just hoping. We wish you happy and successful trading!
FAQ
What is volume analysis in trading?
Volume analysis examines trading activity levels to understand market participation and confirm whether price moves are supported by strong buying or selling interest.
Why does volume help predict market moves?
High volume often confirms trends or breakouts, while low volume can signal weak momentum or potential reversals in price direction.
How can traders use volume in strategies?
Traders use volume to validate breakouts, detect accumulation or distribution, and improve timing for entries and exits.
Does FXSI provide tools for volume-based analysis?
FXSI offers charting and market data tools that help traders monitor activity levels and better interpret market momentum.