Market cycles follow predictable phases—expansion, peak, contraction, and trough—each requiring different trading approaches. We’ll spot transitions through yield curve inversions, technical patterns like head-and-shoulders (65% reliable!), and shifts in leading indicators. Stocks shine during recovery while bonds become heroes in downturns. Smart traders adapt their portfolios accordingly, shifting from growth stocks during expansion to defensive positions as cycles mature. Understanding both the technical signals and investor psychology alters market volatility from your enemy to your profit machine.

The Anatomy of Market Cycles and Their Fundamental Drivers
While the market may seem like a chaotic rollercoaster to the uninitiated, it actually follows recognizable patterns that we call market cycles. These cycles move through distinct phases—expansion, peak, contraction, and trough—each requiring different investment approaches.
What drives these cycles? Surprisingly, it’s not primarily technology or productivity shocks. Rather, demand-driven models better explain market behavior, especially when amplified by herd mentality. We’ve all seen how everyone piles into the same investments!
Market concentration plays a critical role too. When a handful of stocks dominate indices (looking at you, tech giants), they can exacerbate boom-bust patterns. This concentration isn’t random—it’s often worsened by massive passive investment flows that, ironically, make markets less efficient.
Recognizing Key Indicators of Market Cycle Transitions
We’ll now turn our attention to spotting those vital turning points in market cycles that separate the pros from the amateurs.
Technical reversal patterns like head-and-shoulders or double bottoms often telegraph major shifts before price action confirms them, giving savvy investors a vital edge.
Meanwhile, economic leading indicators such as building permits and manufacturing orders typically change direction 3-6 months ahead of the broader economy, providing us with an early-warning system that’s worth its weight in gold.
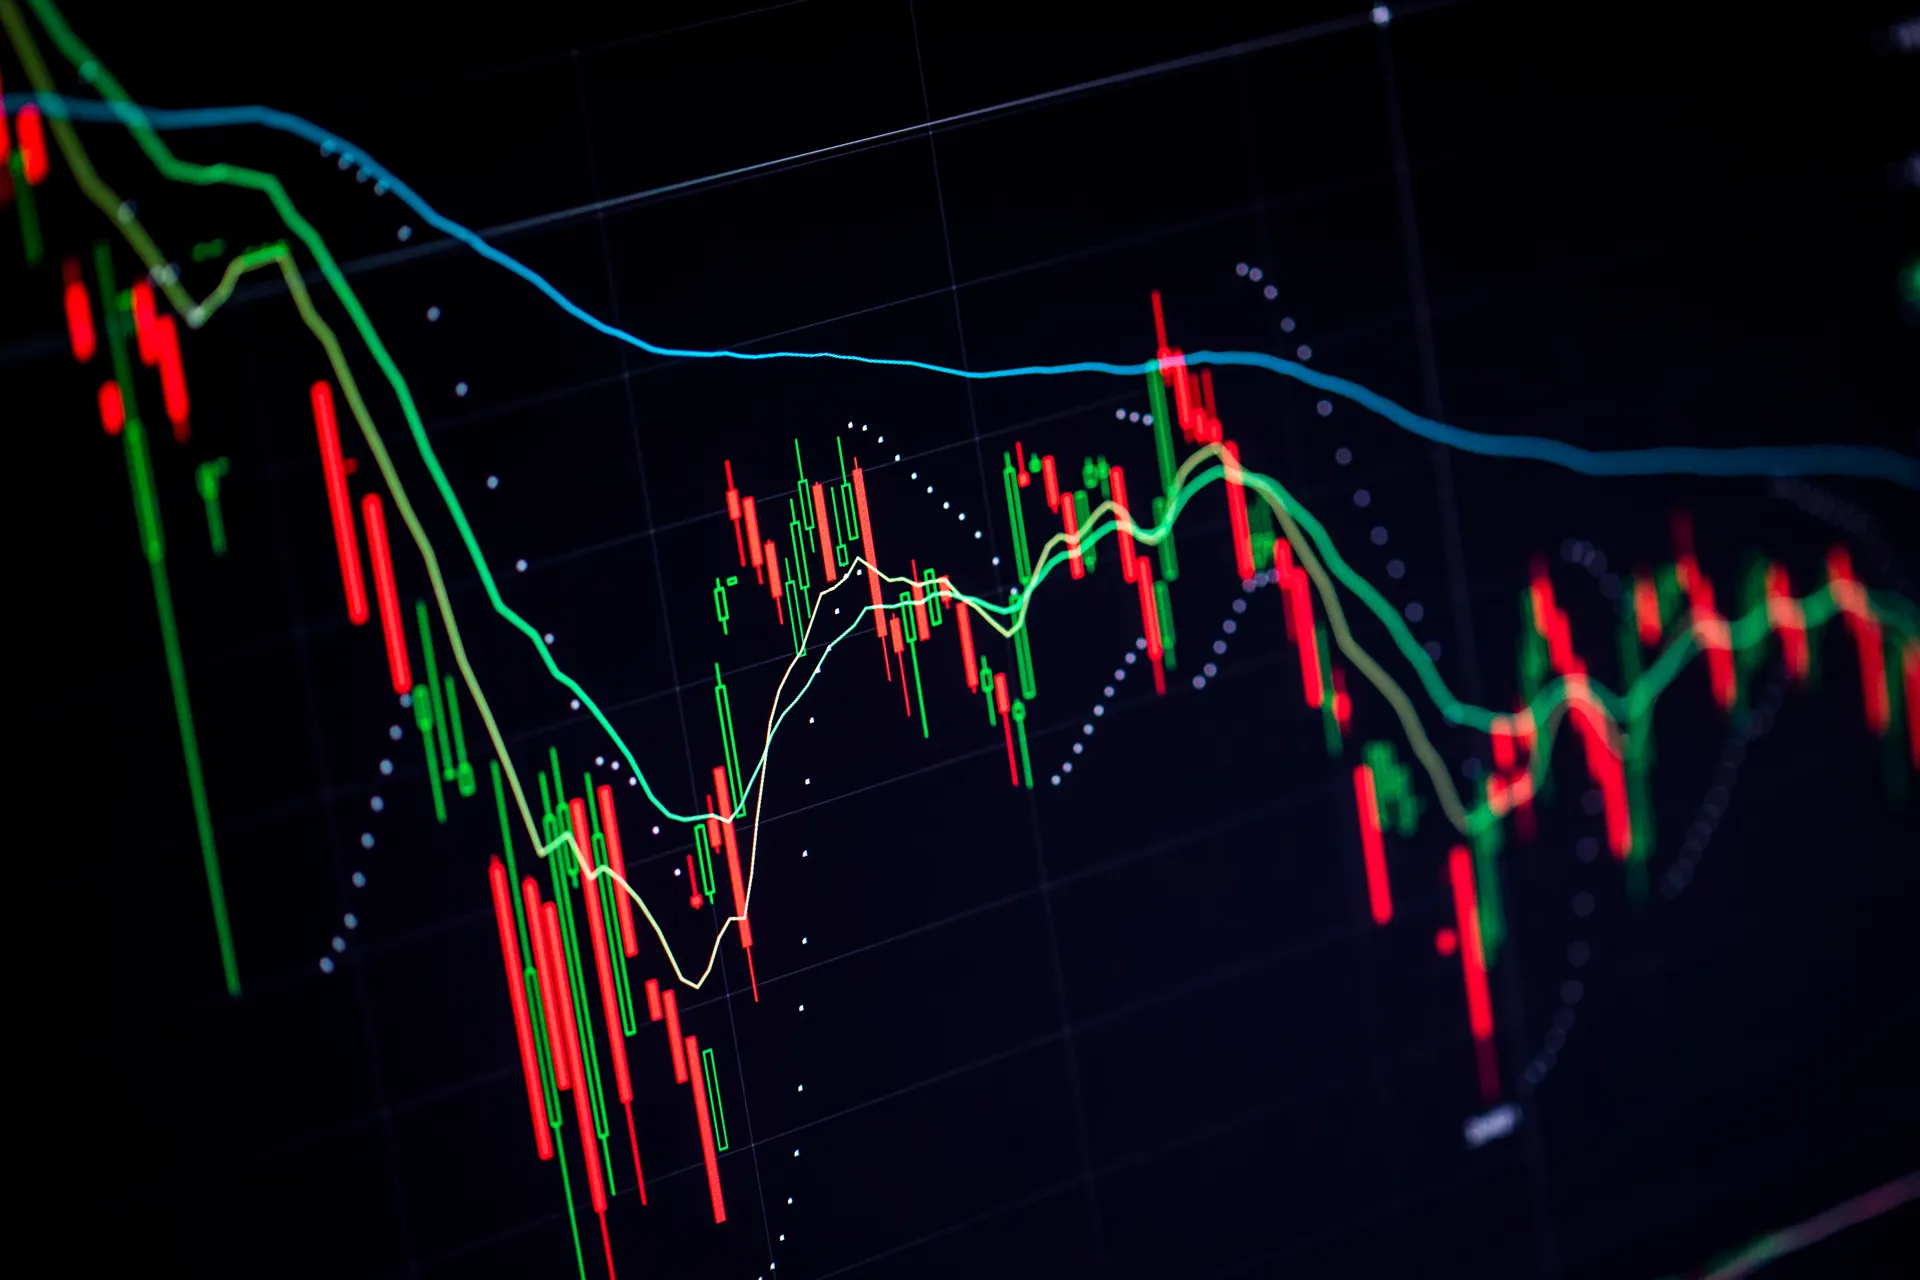
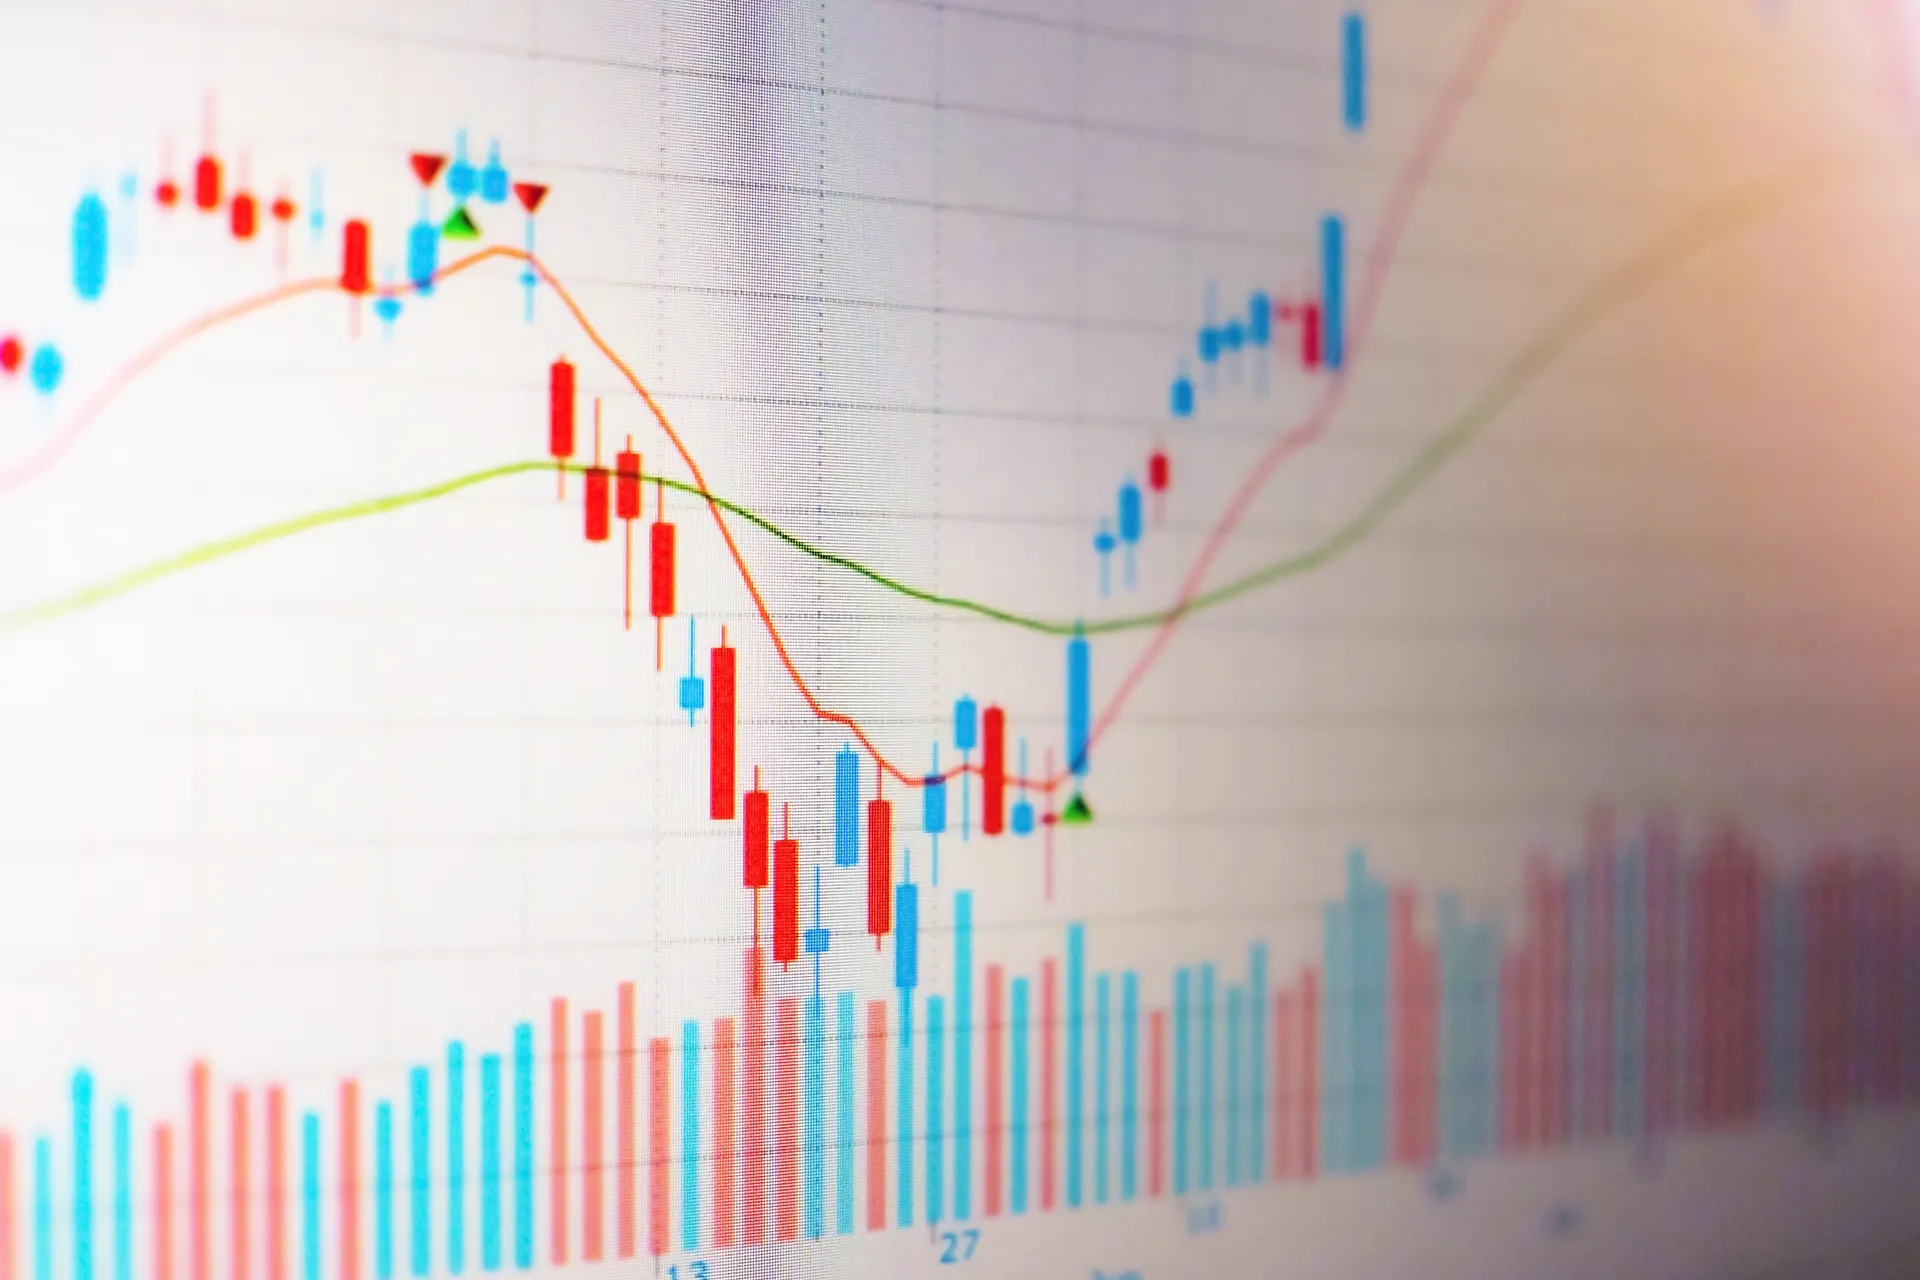
Technical Reversal Patterns
As markets rise and fall, they leave behind distinctive footprints on price charts that savvy traders have learned to recognize and exploit.
These technical reversal patterns signal when the tide is turning, often before the crowd catches on.
Head and shoulders formations—with their telltale three-peak structure—are bearish signals with impressive 65% success rates. Their bullish counterparts, inverse head and shoulders, emerge when markets are ready to climb from the depths.
Double tops and bottoms? They’re the market’s way of saying, “I’ve tried twice and I’m done!”
We’ve found these patterns work best when confirmed by volume and momentum indicators like RSI and MACD.
When you combine reversal pattern recognition with broader cycle analysis, you’re not just trading—you’re trading with the rhythm of the market.
Economic Leading Indicators
Technical patterns tell us where we’ve been—economic leading indicators show us where we’re headed. These forward-looking metrics give us the edge in anticipating market shifts before they become obvious to the crowd.
The stock market itself is predictive—when the S&P 500 starts tanking, it’s usually waving a red flag six months before the broader economy notices.
Watch for the yield curve inversions; they’ve preceded nearly every recession in modern history. (When 2-year yields exceed 10-year yields, it’s time to fasten your seatbelts!)
Consumer confidence, building permits, and new orders for consumer goods round out our crystal ball toolkit.
For reliable data, we turn to OECD’s Composite Leading Indicators, business surveys, and FMP’s Economic Indicators API—because timing isn’t everything in trading, it’s the only thing!

How Different Asset Classes Respond Throughout Economic Phases
In this phase of our market cycle expedition, we’ll examine how stocks tend to shine in recovery phases but retreat during slowdowns—patterns that repeat with surprising reliability across decades.
We can’t overlook fixed-income investments, which change from underperformers during expansions to portfolio heroes when downturns arrive, demonstrating their vital defensive properties.
Alternative assets like REITs, gold, and commodities each dance to their own cyclical rhythm, offering strategic opportunities for investors who understand their unique timing across the four economic phases.
Stock Behavior Across Phases
Different asset classes dance to their own rhythm during market cycles, creating a predictable choreography for those who know what to watch.
During accumulation phases, we’ll see stocks meandering sideways while savvy investors quietly build positions in undervalued companies—think of it as the market’s whisper phase before the shout.
When we hit the mark-up phase, stocks take center stage with rising prices and increased trading volume.
Growth-oriented companies typically steal the spotlight here, though they often come with a valuation risk hangover!
In bull markets, tech and innovation-driven sectors dominate, while bear markets favor the boring-but-reliable defensive sectors.
It’s like watching extroverts and introverts swap popularity at different parties.
The key is recognizing which market party you’re attending and dressing appropriately.
Fixed-Income Defensive Properties
Fixed income assets serve as the steady anchors of investment portfolios when market storms begin to rage. Their stability isn’t accidental—it’s by design. When equity markets tumble, high-quality bonds often move in the opposite direction, providing that vital buffer against volatility.
We’re particularly fond of government bonds during late-cycle and recessionary periods. Why? They’re the financial equivalent of comfort food—reliable, predictable, and satisfying when everything else feels uncertain. These instruments typically offer lower but stable returns while their corporate cousins might be struggling with widening credit spreads.
The real magic happens through diversification. By blending fixed income across your portfolio, you’re essentially telling market volatility, “Nice try, but we’ve got protection!”
Alternative Assets’ Cyclical Nature
Alternative assets dance to their own rhythm throughout market cycles, often performing their most impressive moves when traditional investments stumble.
Real estate values typically surge during recovery phases, while private equity shines in late-cycle environments just before downturns.
Infrastructure investments? They’re the steady drummers, keeping the beat regardless of economic turbulence.
We’ve seen commodities react dramatically to growth patterns and trade policies—just watch oil prices during economic expansions!
Collectibles often peak when wealth accumulation hits its stride in late-cycle phases.
When the economic orchestra shifts tempo, these asset classes respond uniquely, creating prime diversification opportunities.
The Psychology of Market Sentiment Across Cycle Stages
While technical indicators provide the scaffolding for market analysis, it’s the psychology of investors that truly builds or demolishes asset values throughout market cycles.
We’ve all witnessed how sentiment shifts dramatically across different phases—from the skeptical optimism of Unveiling to the unbridled euphoria of the Blow-off phase.
During Momentum phases, FOMO takes the wheel as investors pile in, afraid of missing those juicy returns. This is precisely when our rational brains take a backseat!
When FOMO drives your investing, your logical decision-making gets left behind at the station.
Then comes the inevitable Transition, where denial reigns supreme before giving way to the panic selling of Deflation.
Understanding these psychological patterns helps us recognize when markets are overheating.
The best traders aren’t just chart wizards—they’re amateur psychologists who can read the emotional temperature of the market and position accordingly. They understand that market movements are often driven by fear and greed, and they use this knowledge to anticipate shifts in sentiment. During the commodity trading market hours, these traders pay close attention to news and events that could influence buyer and seller behavior. By staying in tune with the market’s emotional landscape, they can make informed decisions that lead to profitable trades, even in volatile conditions.
Developing Trading Strategies for Each Market Phase
During mark-up phases, we’re riding the uptrend with the early majority, watching for those higher lows and highs while volume increases.
Technical analysis becomes our best friend here—200-day moving averages and RSI readings aren’t just fancy jargon, they’re essential guidance tools!
How Do Market Fluctuations Influence Economic Phases in Trading?
Market fluctuations play a crucial role in shaping economic phases in trading. When prices oscillate, they reflect changes in supply and demand, influencing investor sentiment. Understanding how market dynamics impact trading decisions can help traders adapt strategies, mitigate risks, and capitalize on opportunities throughout varying economic cycles.
Historical Market Cycles: Lessons From Past Economic Shifts
Looking back at market history isn’t just an academic exercise—it’s our financial time machine that helps predict future moves. The rhythm of bull and bear markets typically follows a 4-7 year cycle, though exceptions exist—like that marathon 11-year bull run from 2009-2020 (what a party that was!).
We’ve weathered some doozies: the 1929 crash triggering the Great Depression, stagflation during the 1970s oil crises, and the dot-com bubble’s spectacular pop in 2000. Each disaster taught significant lessons about market psychology and recovery patterns.
What’s fascinating is how real-world events reshape these cycles. WWII spending reversed economic decline, while COVID-19 created the shortest bear market on record.
Understanding these historical patterns gives us framework for today’s market conditions—and perhaps a glimpse into tomorrow’s.
Portfolio Positioning and Risk Management Through Cyclical Changes
Since market cycles don’t politely announce their arrivals, we’ve got to position our portfolios proactively—not reactively. Economic indicators like GDP growth, inflation levels, and interest rates serve as our early warning system. When expansion phases hit, we tilt toward growth stocks and cyclical sectors (think tech and consumer discretionary), but as cycles mature, we gradually pivot to quality equities with solid balance sheets.
Diversification isn’t just a buzzword—it’s your financial bulletproof vest. Spreading investments across sectors, geographies, and asset classes helps weather inevitable volatility.
Don’t be afraid of defensive stocks during downturns; they’re like financial comfort food when markets get queasy. And remember, central bank actions aren’t just academic exercises—they’re direct signals for portfolio adjustments. Rising rates? That might be your cue to reduce duration risk in fixed income holdings.
FAQ
What are market cycles?
Market cycles are phases of expansion, peak, contraction, and recovery that influence asset prices and trading opportunities.
Why do cycles matter for traders?
Different phases favor different strategies, making it important to adapt trading approaches to current market conditions.
How can traders identify cycle changes?
Traders monitor economic data, trends, and sentiment to recognize shifts between growth and slowdown phases.
Can tools help track market cycles?
Market analysis tools and economic insights help traders stay informed about broader trends affecting trading decisions.